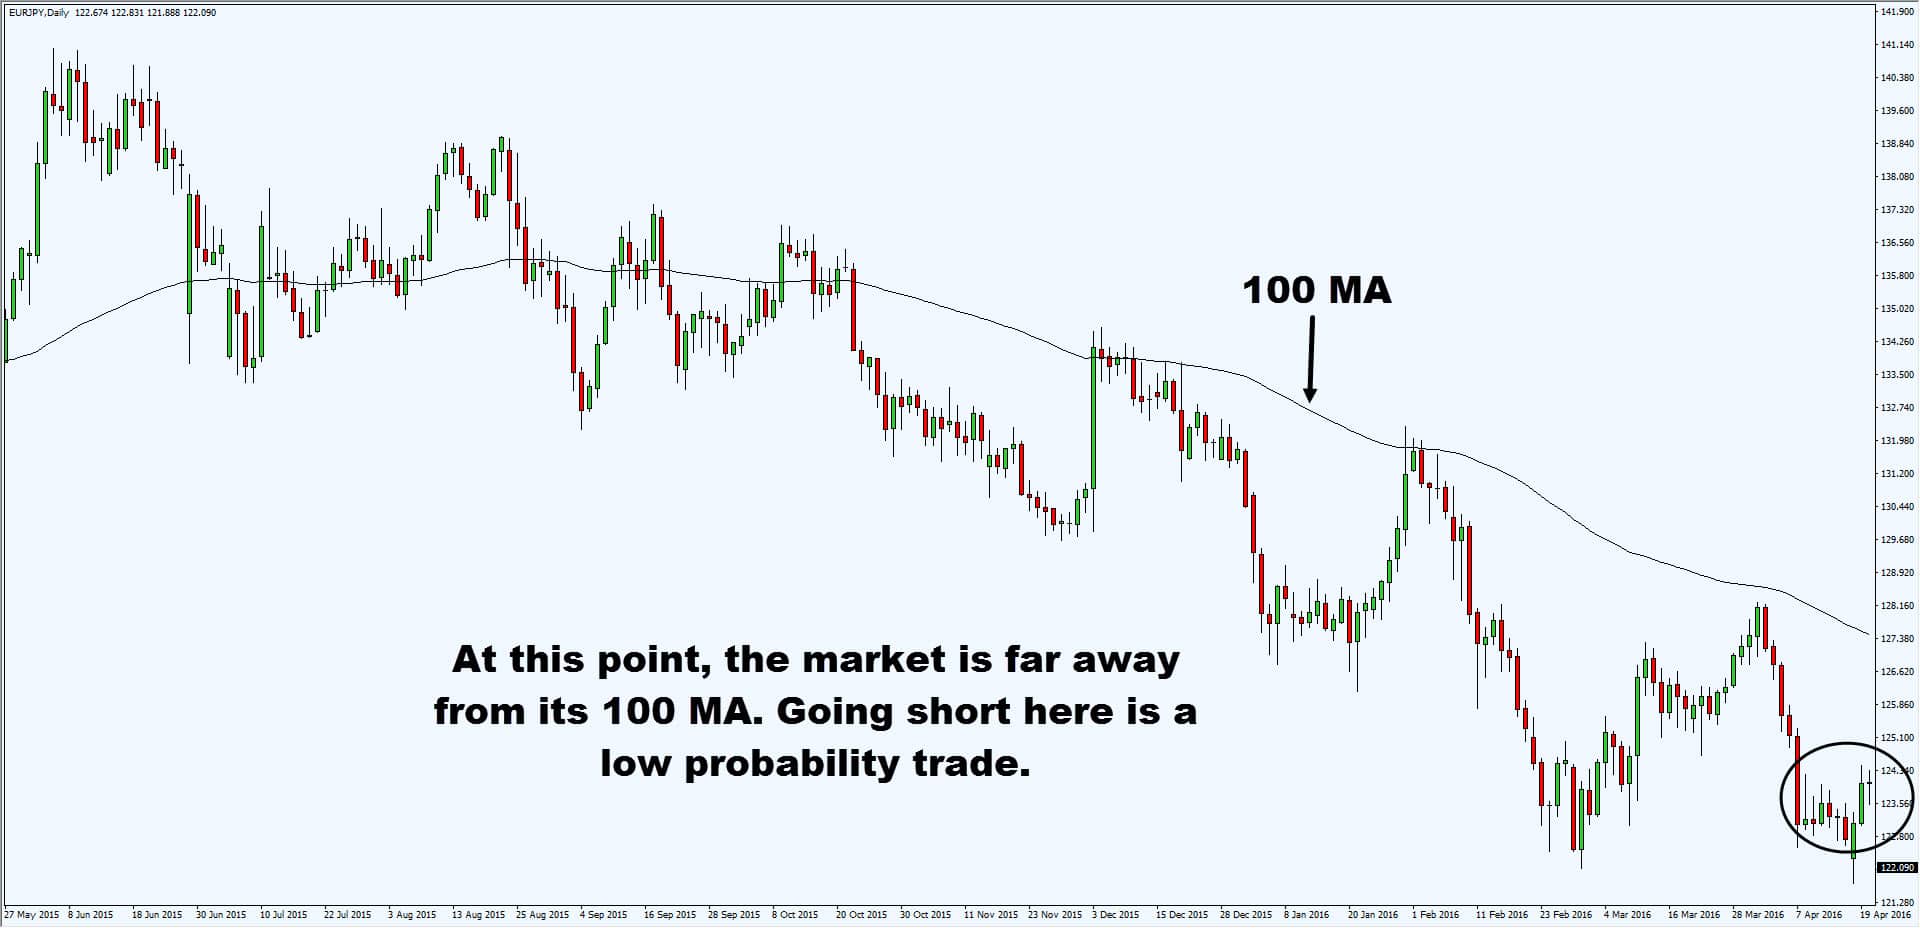
1. Avoid
trading when the market is far away from the moving average
When the market is trending, it tends to mean revert towards the moving
average.
Depending on the type of trend you’re in:
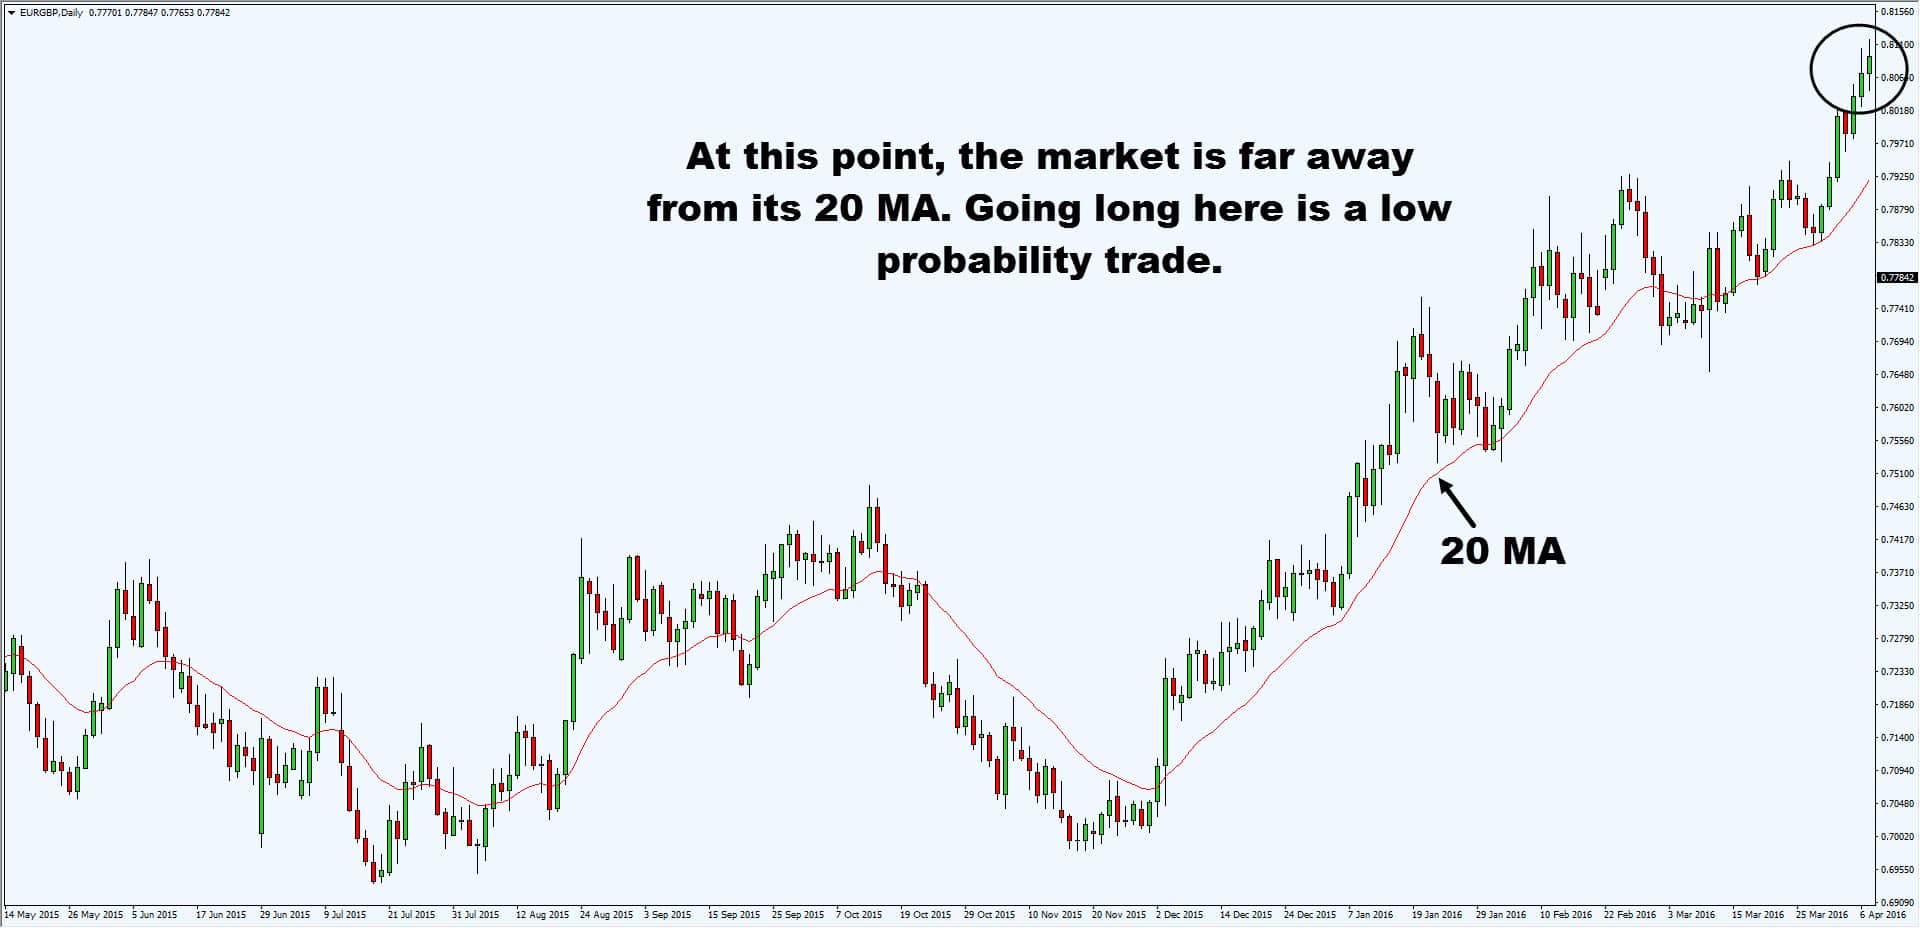
- In a strong trend, the
market tends mean revert to the 20 MA.
- In a normal trend, the
market tends to mean revert to the 100 MA
- In a weak trend, the market
tends to mean revert to 200 MA
Thus, the last thing you want to do is enter a trade when the market is
far away from it’s moving average.
Here’s what I mean:
Pro tip:
You need to identify the moving average that is currently being
“respected” by the markets.
In a strong trending market, the moving average value is lower, and in
weak trending markets, the moving average value is higher.
If you want to learn how to trade with moving averages, I would
recommend reading Moving
Average 101, by Steve Burns.
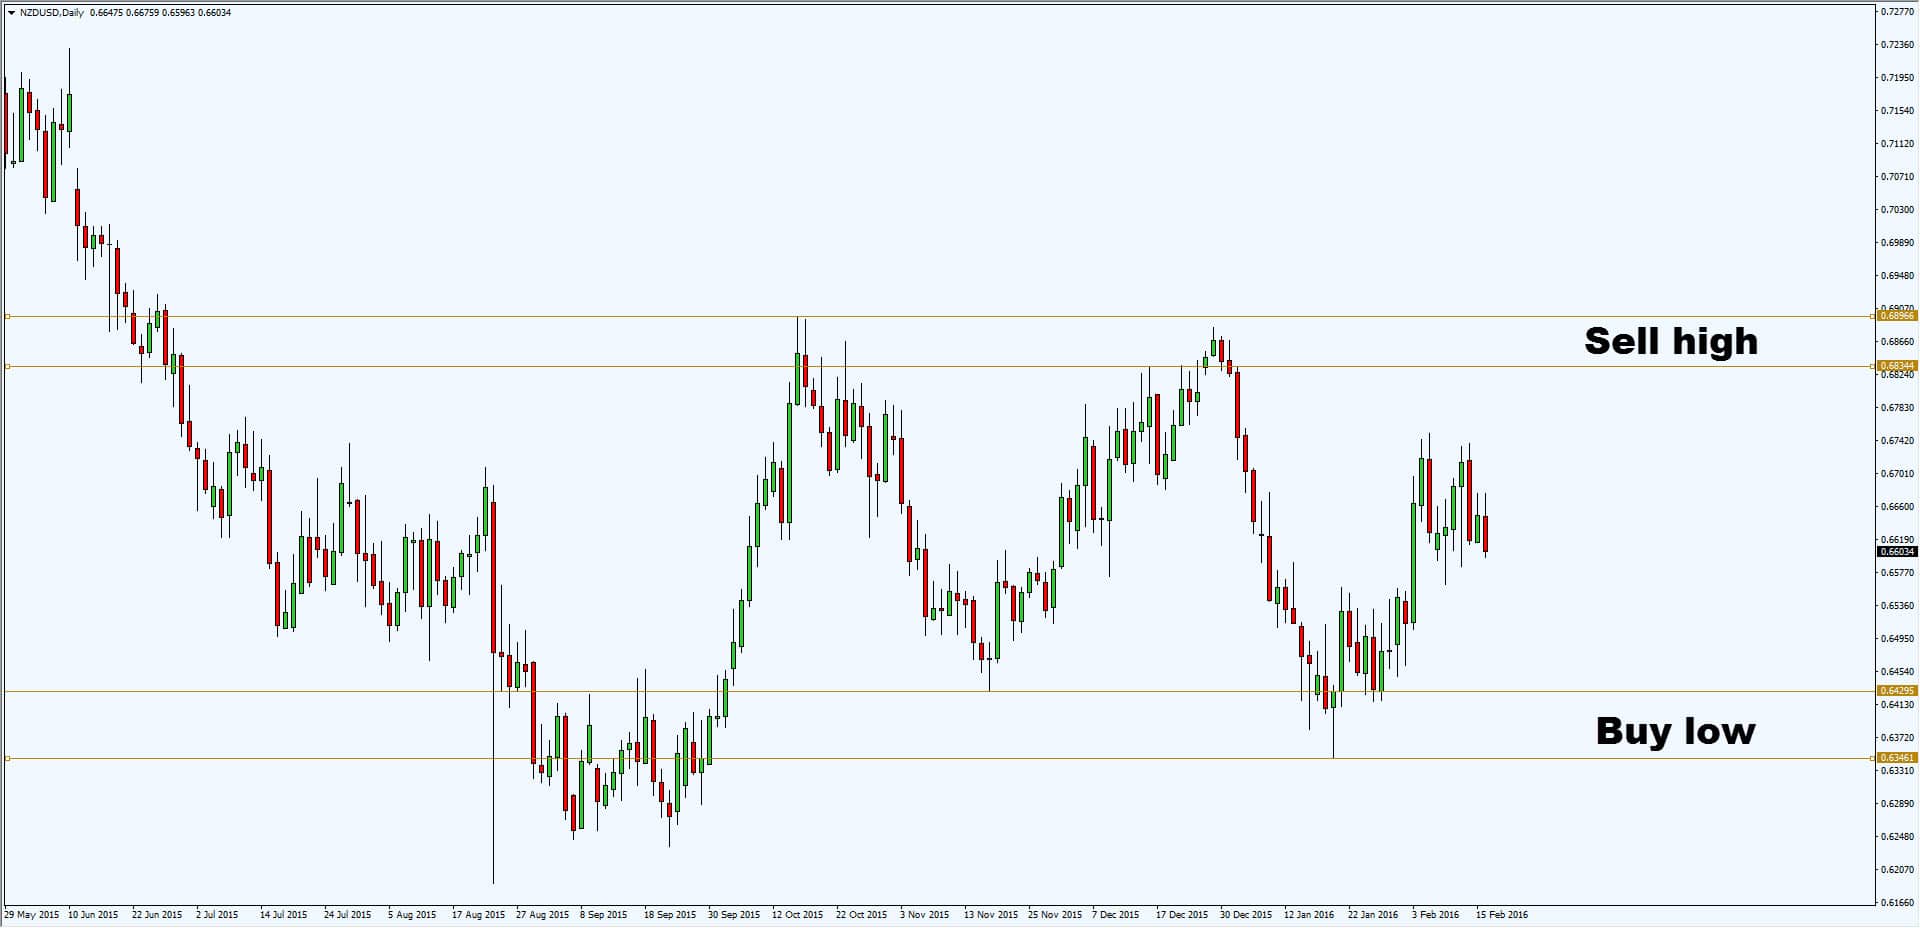
2. Support
& resistance helps you identify areas of value to trade from
You want to buy low and sell high, right?
But the question is:
How do you define what’s low and what’s high?
Allow me to introduce to you…
Horizontal support & resistance
This is useful because it helps you identify areas of value on the
chart.
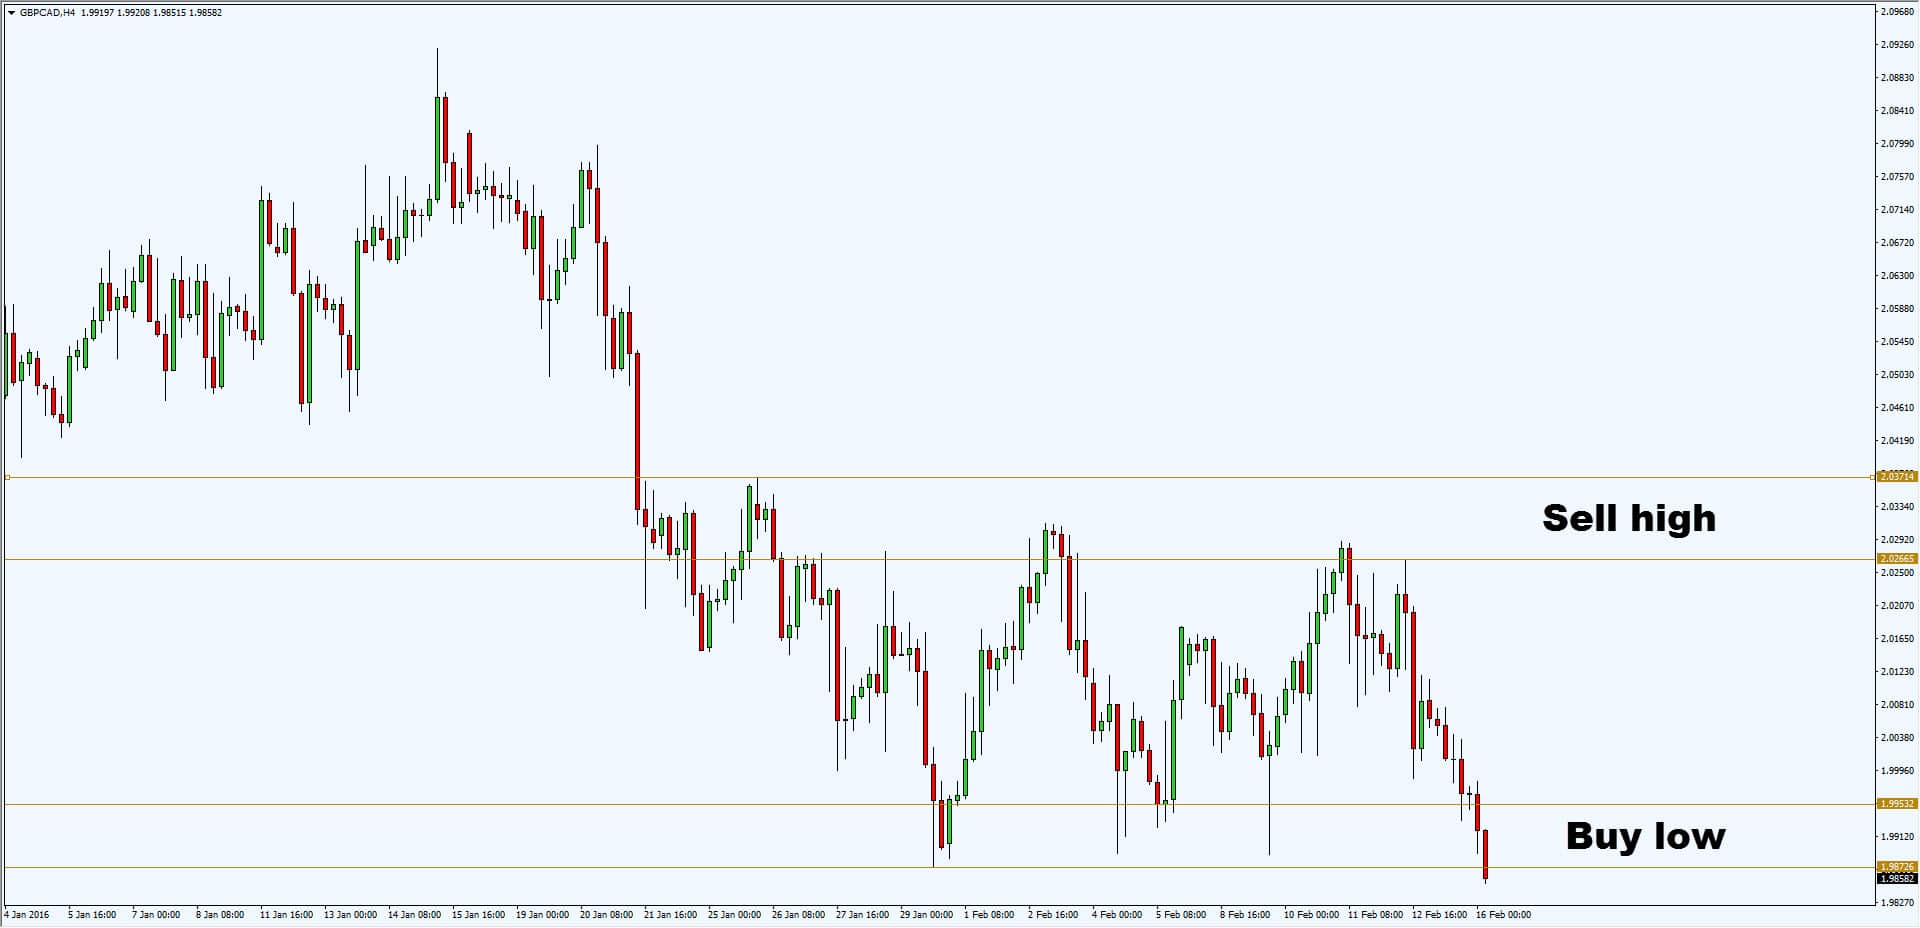
Support – Area on the chart where you’re
are looking to buy “low”
Resistance – Area on the chart where you’re looking
to sell “high”
Here are a few examples:
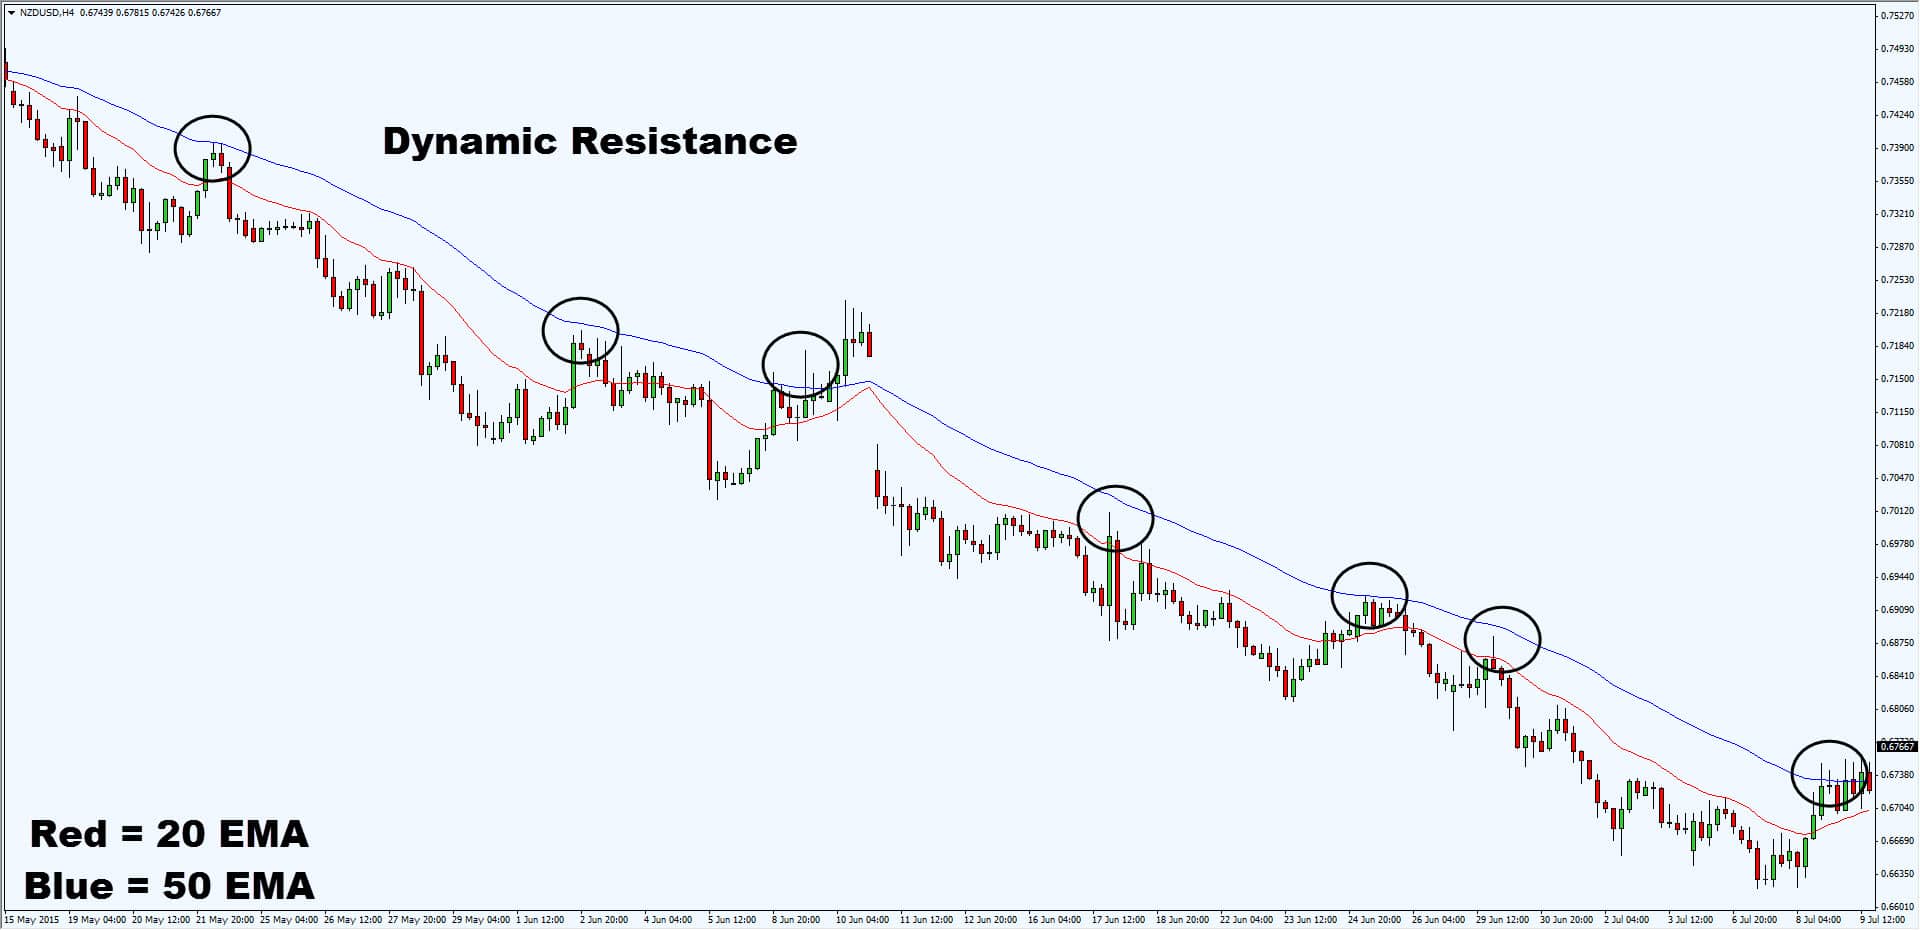
Also, moving average helps you identify areas of value in the form of…
Dynamic support & resistance
These are Support & Resistance that moves along with the price.
Dynamic support occurs in an uptrend, and dynamic resistance in a
downtrend.
They can be identified using moving averages. (I use 20 & 50 EMA).
This is what I mean…
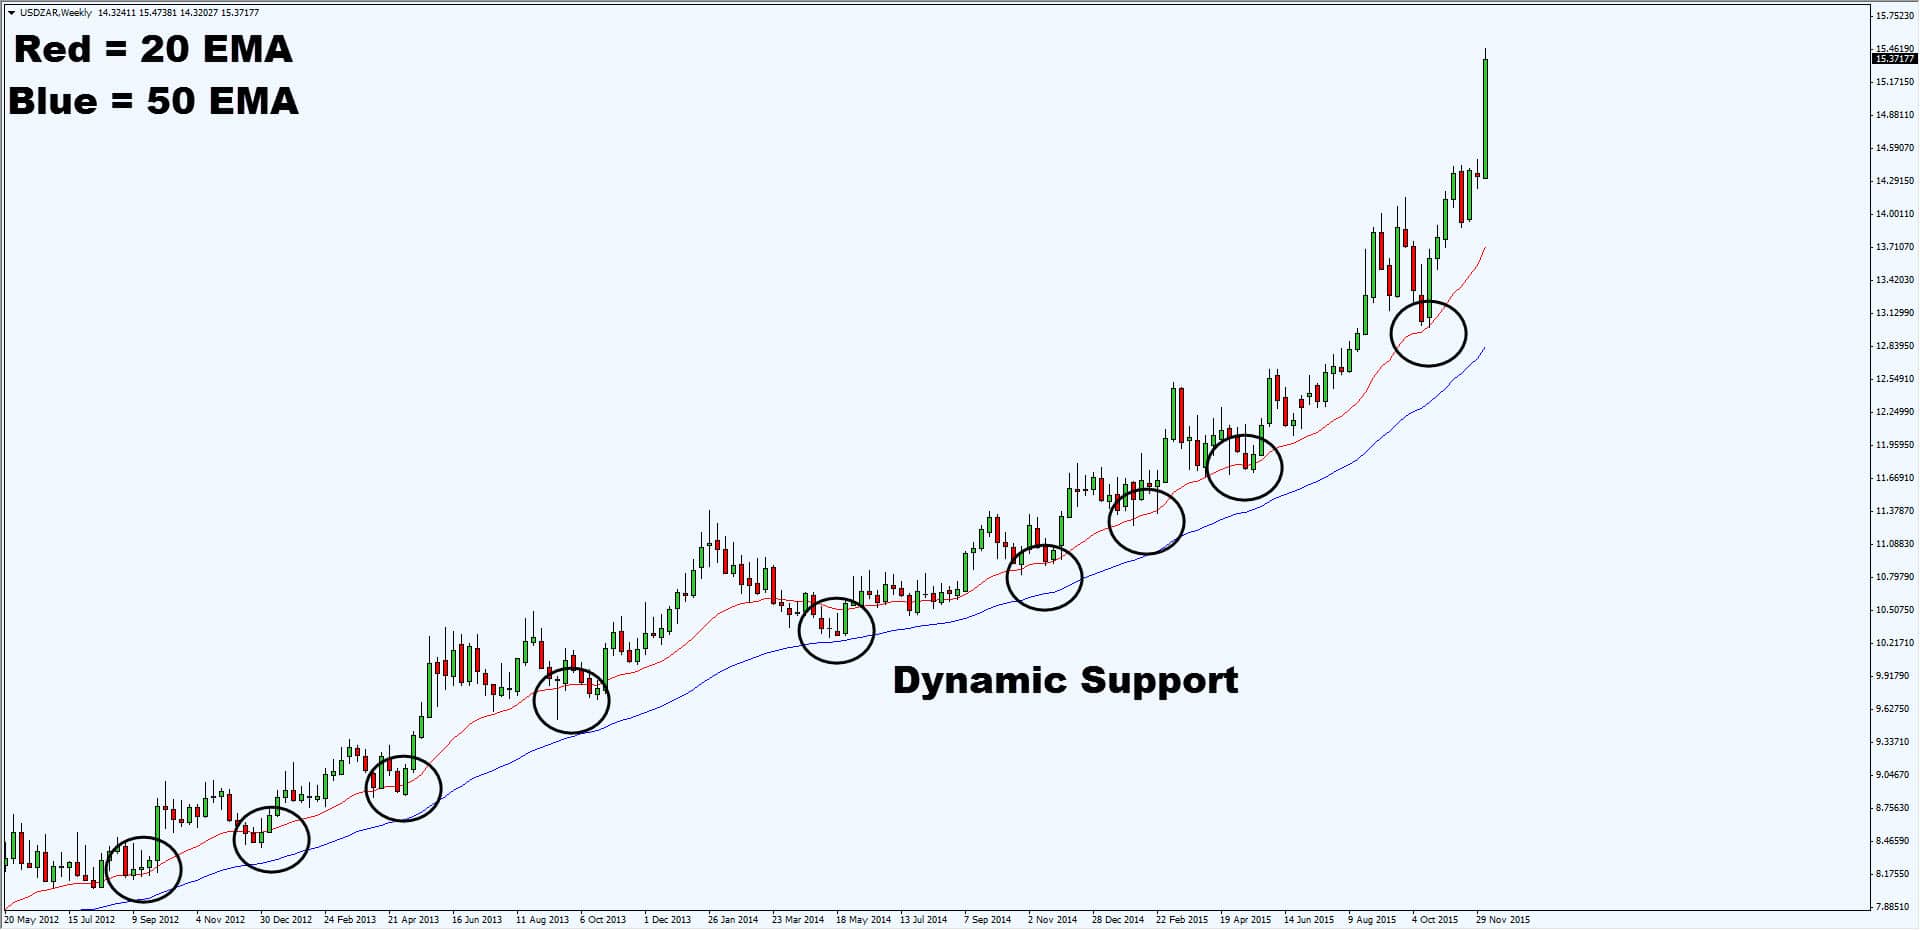
Pro tip:
In a strong trending market, the price may not pullback towards
horizontal support & resistance (which cause a lot of traders to miss the
trend).
Instead, they tend to pullback towards dynamic support & resistance,
which is an area of value you must pay attention to.
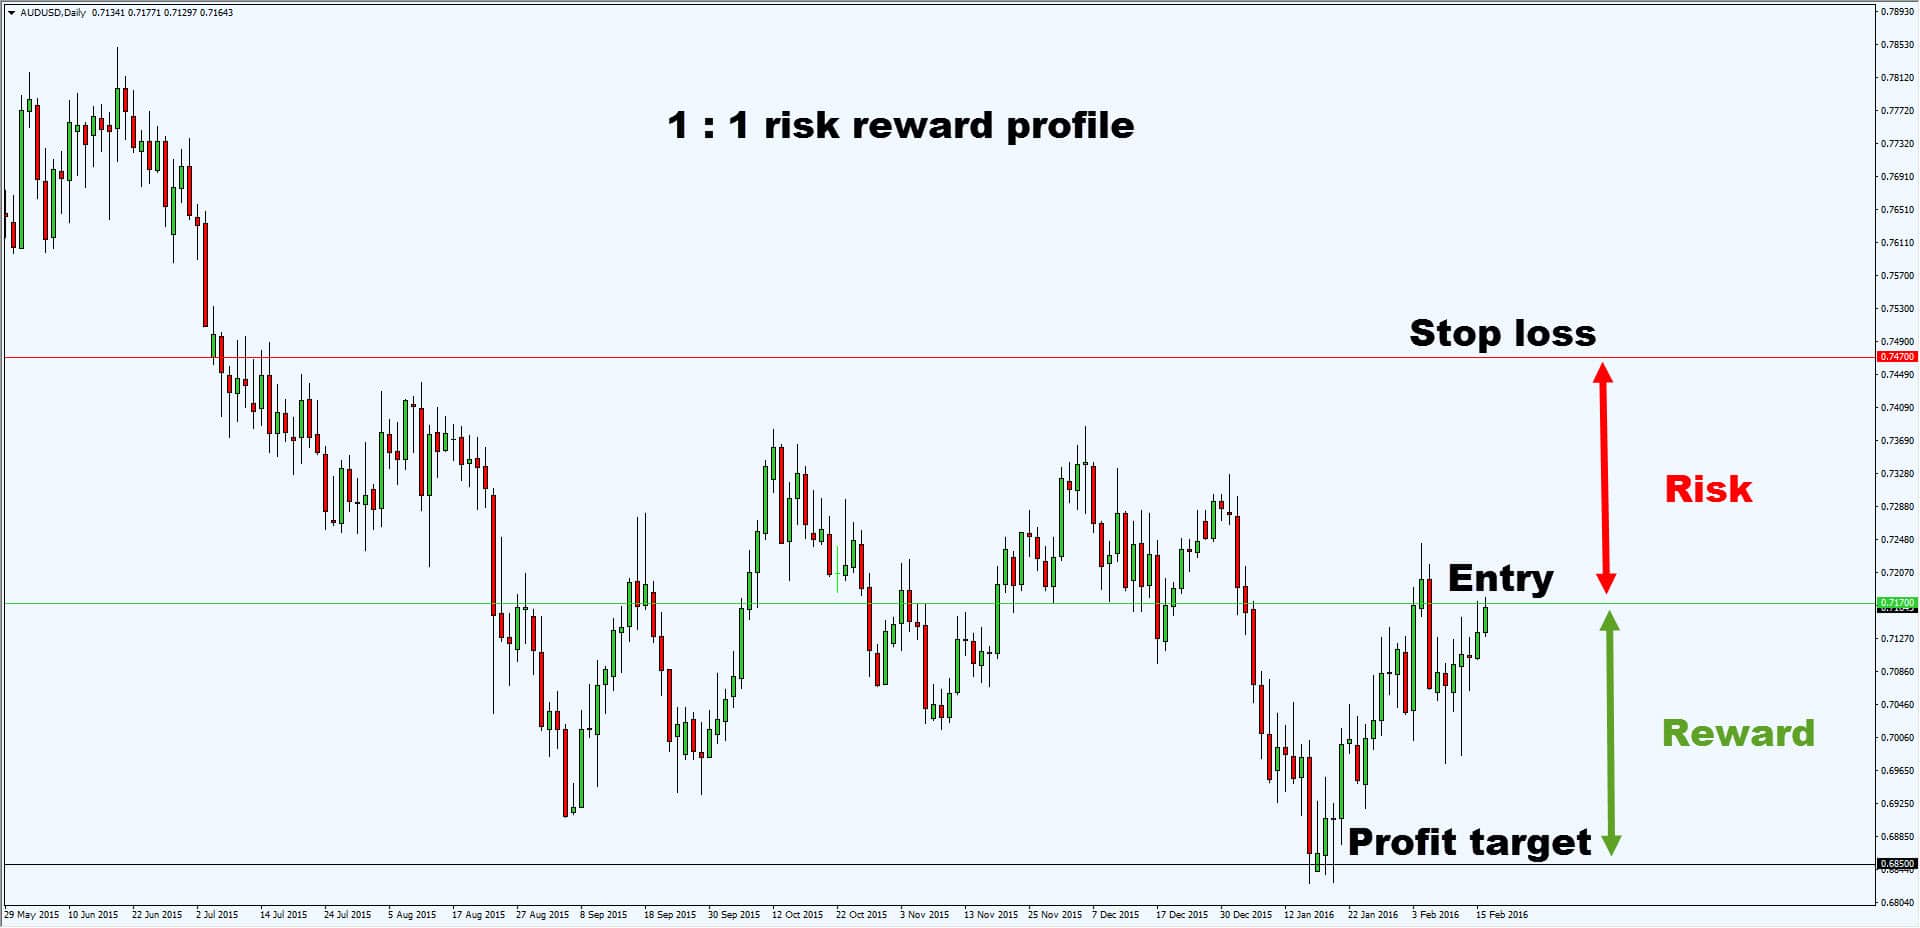
3. Trading at
support & resistance gives you favorable risk to reward
Here’s the thing…
If you enter trades in the middle of a range, it never gives you a
favorable risk to reward (at best 1 to 1).
An example:
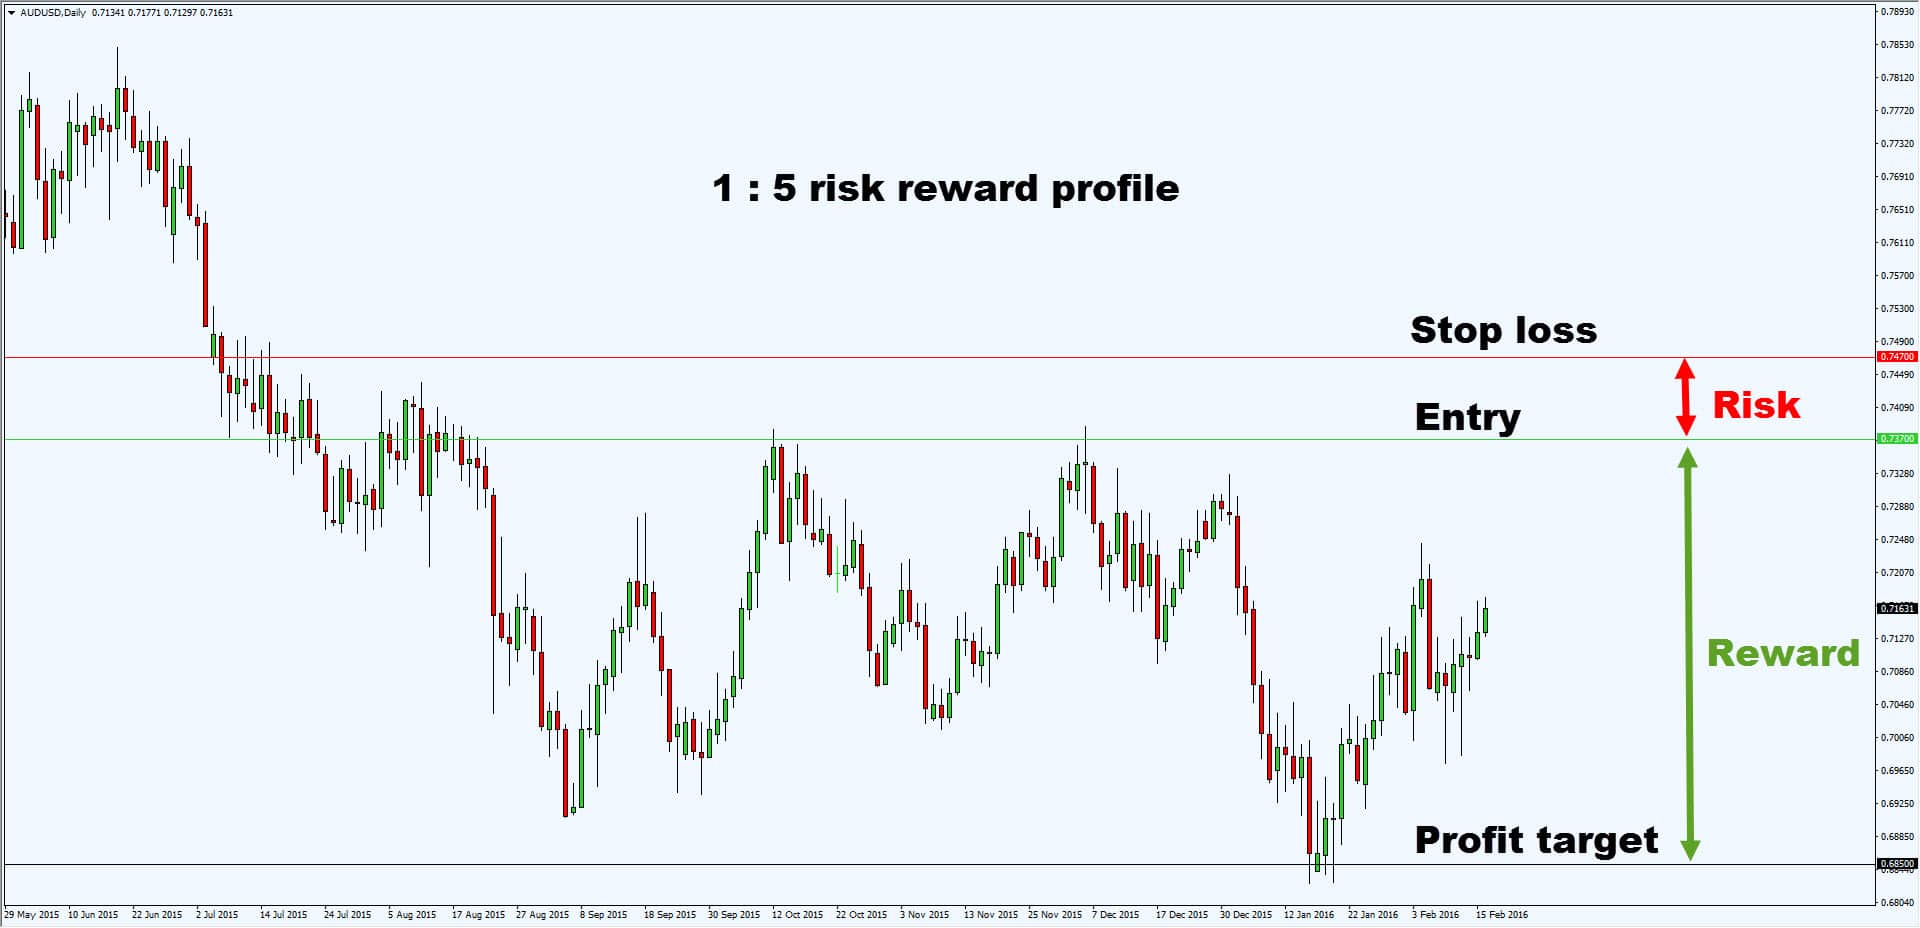
But…
If you enter trades at support & resistance, it would
greatly improve your risk to reward.
Here’s what I mean:
Pro tip:
The risk to reward profile is only one side of the equation. The other
thing you need to take into account is the probability of your trade working
out.
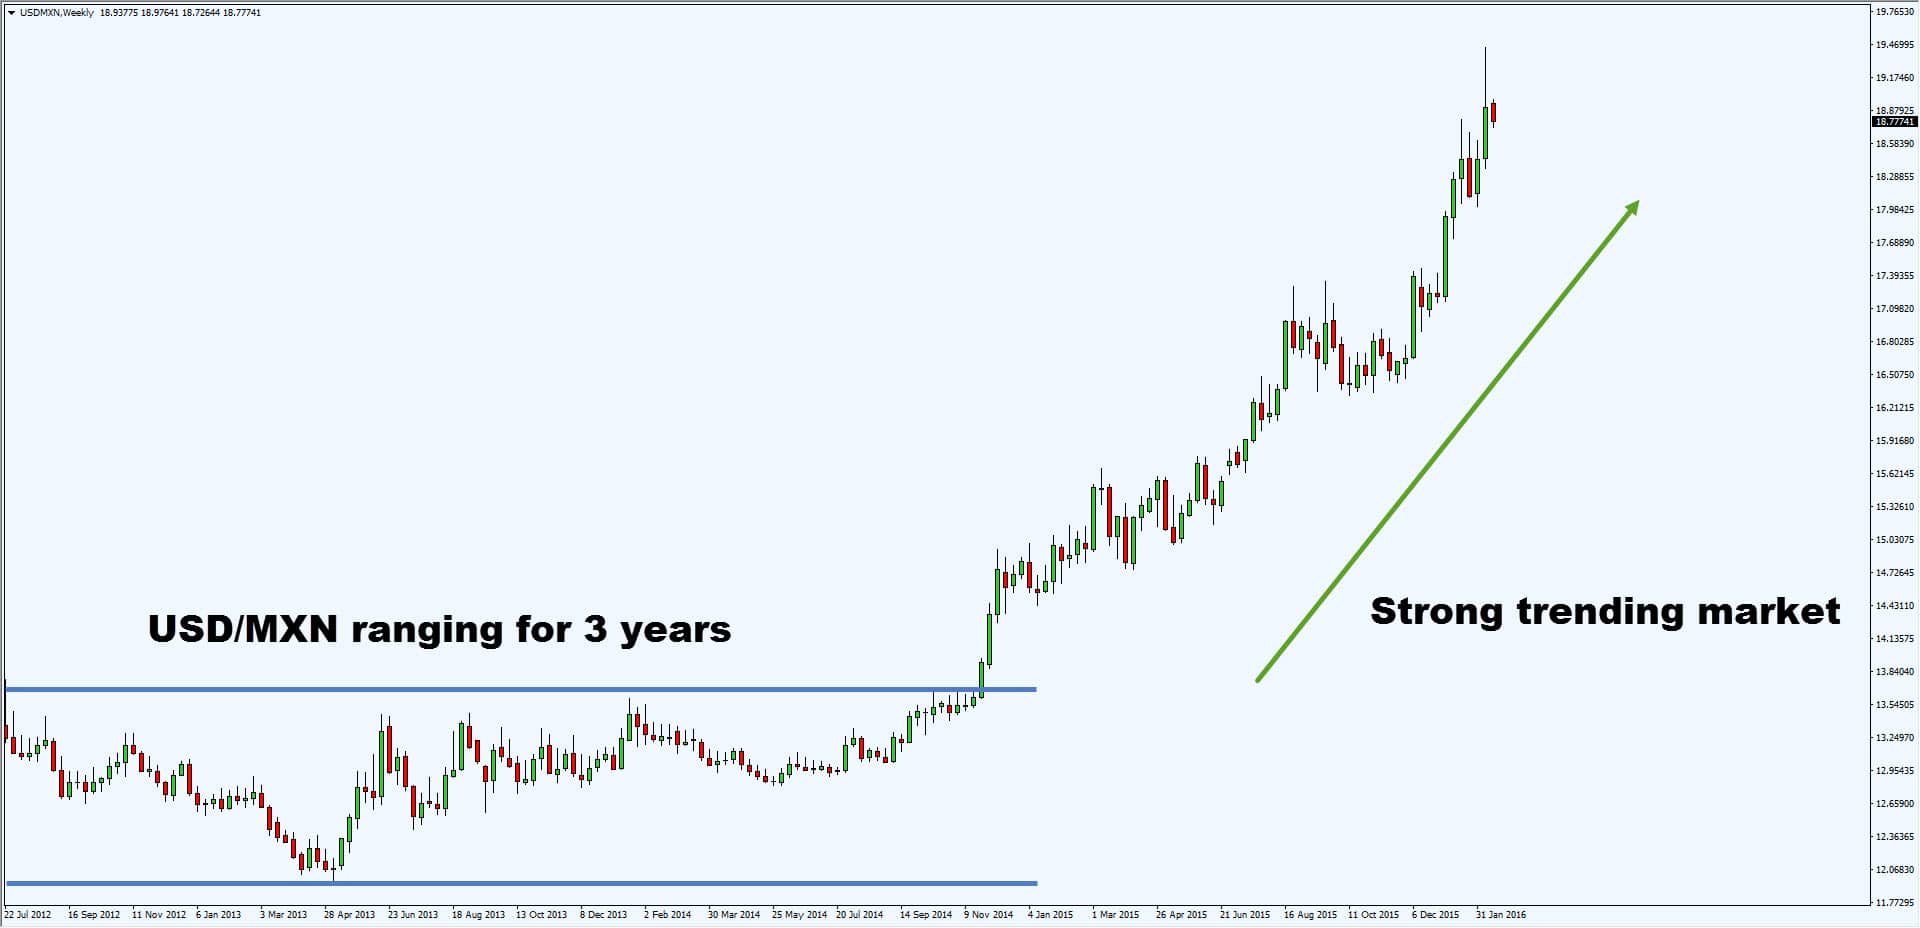
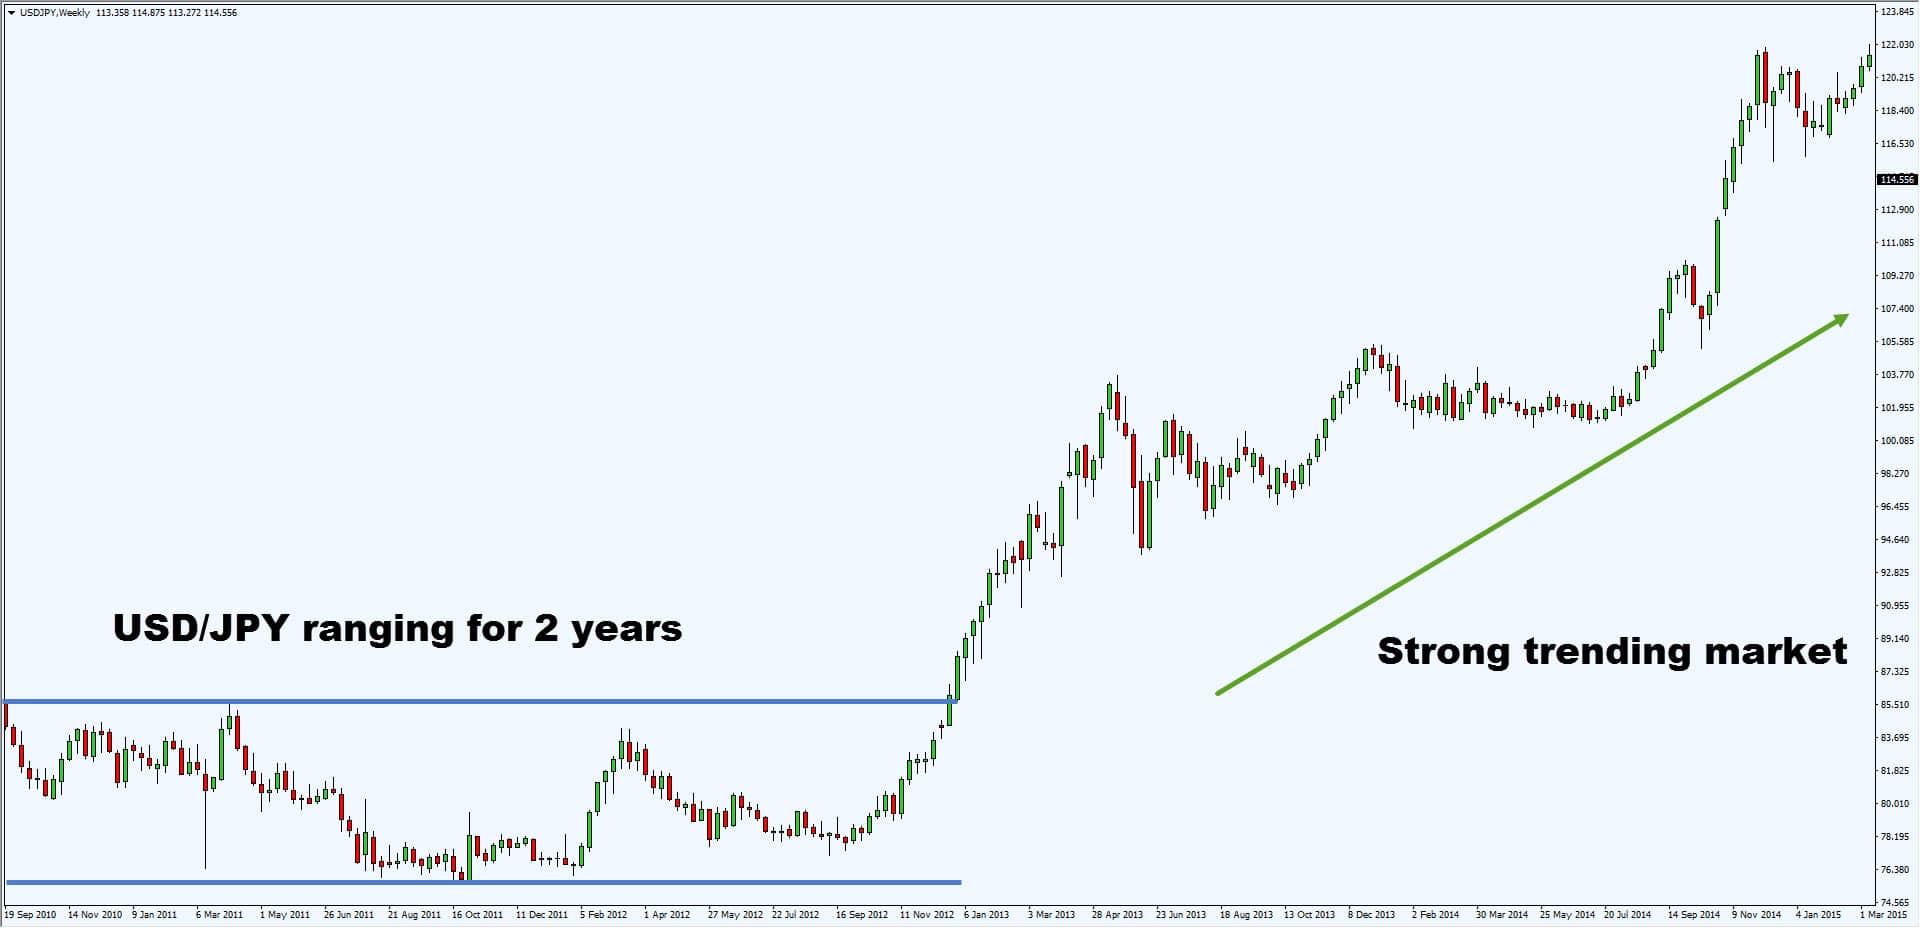
4. The longer
it ranges the harder it trends
If there is a sudden
range expansion in a market that has been trading narrowly, human nature is to
try and fade that price move. When you get range expansion, the market is
sending you a very loud, clear signal that the market is getting ready to move
in the direction of that expansion. – Paul Tudor Jones
If you notice the price has been ranging for a long time, you’re not
alone.
Traders all around the world will be seeing the same charts as you.
Some will be queuing to short the resistance, and some will be trading
the breakout.
If the price does trade above the resistance, shorts will get squeezed,
and breakout traders will hop on the bandwagon.
That’s why price trend for a sustained period of time, due to the
imbalance of buying/selling pressure.
Here are a few examples:
You’re probably wondering:
I don’t have the patience to wait this long. I want
to capture big moves in the market, now.
And this is what I’ll cover next…
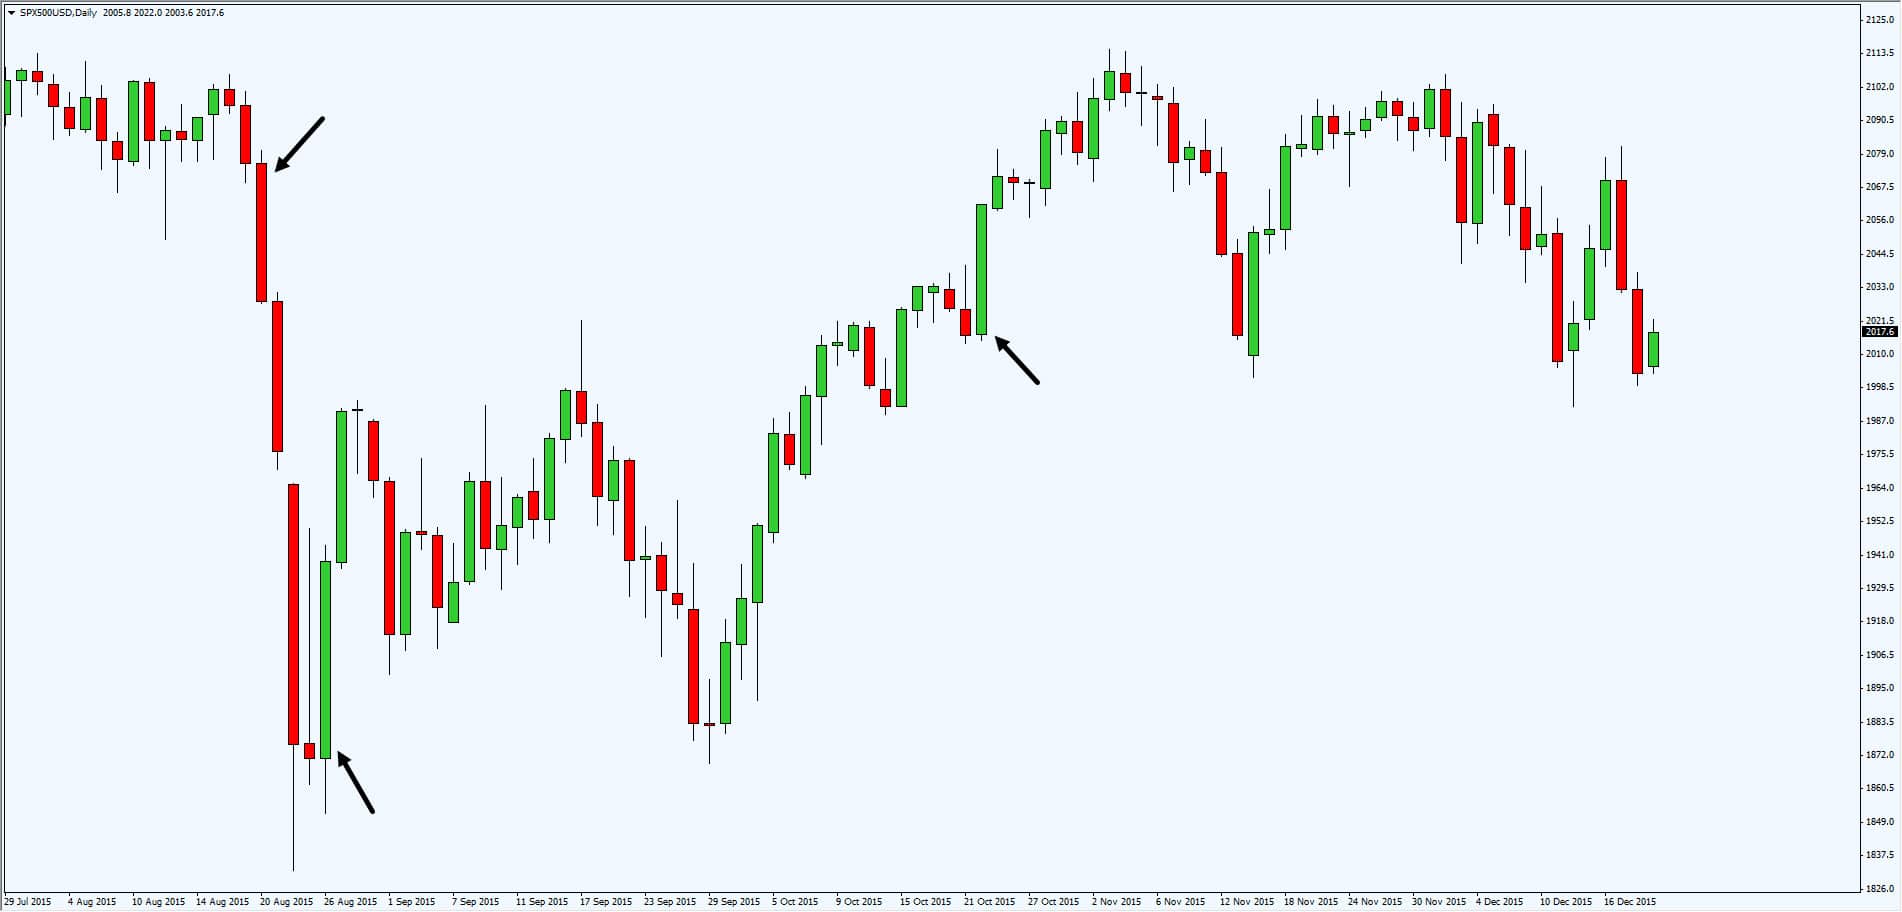
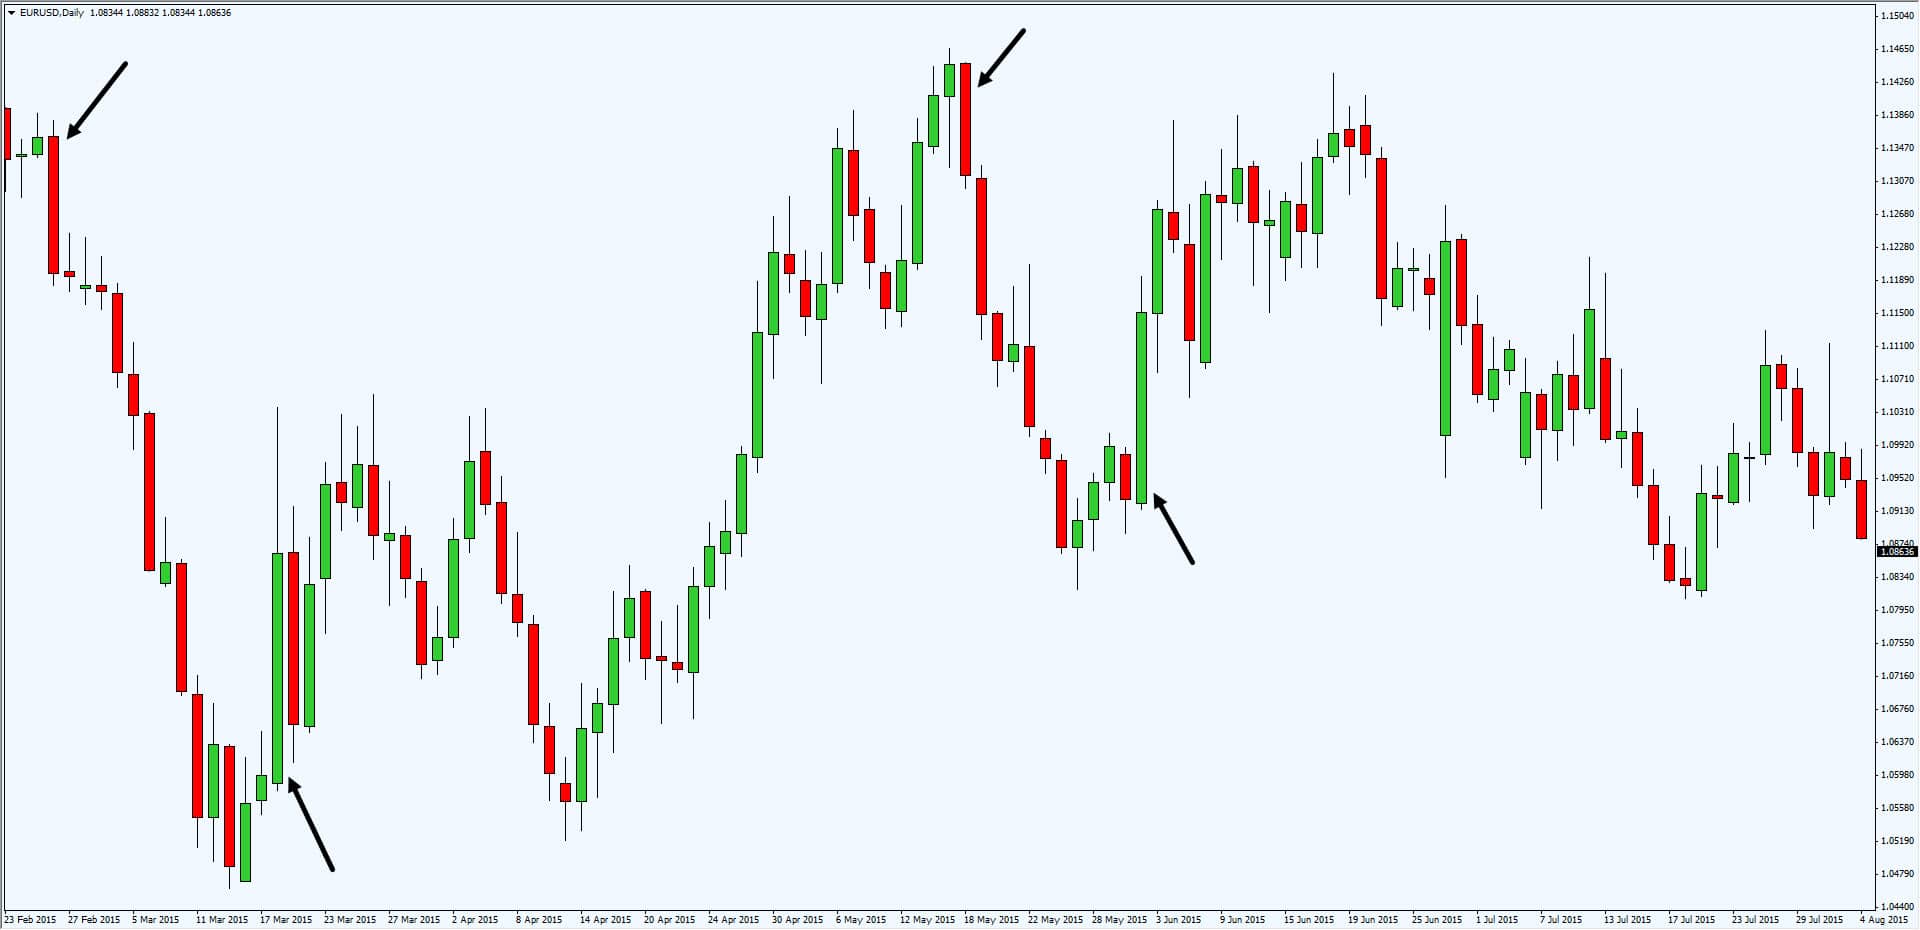
5. Narrow range
candles usually lead to explosive moves
You’ve learnt that the longer price range, the harder it’ll
trend. Now, you can take this concept further and apply it to the
range of candles (instead of time).
The thing you’re looking out for is… narrow range candles.
Why?
Because you can expect an explosive move to occur soon.
Here are a few examples:
So, when you get series of narrow range candles, get ready for an
explosive move.
6. Wide range
candles serve as “hidden” support & resistance
A wide range candle is formed due to an imbalance of buying/selling
pressure.
This represents “hidden” Support & Resistance in the markets (known
as Supply & Demand by Sam Seiden)
Here’s what I mean:
There are traders who swear by Supply & Demand, and some who do just
fine, with Support & Resistance.
Here’s the thing…
You don’t want to trade them in isolation, but use them with other
technical tools, that add
confluence to your trades.
7. False
breakout provides one of the best entry to profit from “trapped” traders
First, let me explain what is a false breakout.
I define false breakout when price breaks support or resistance,
only to close back into the range.
Here’s what I mean…
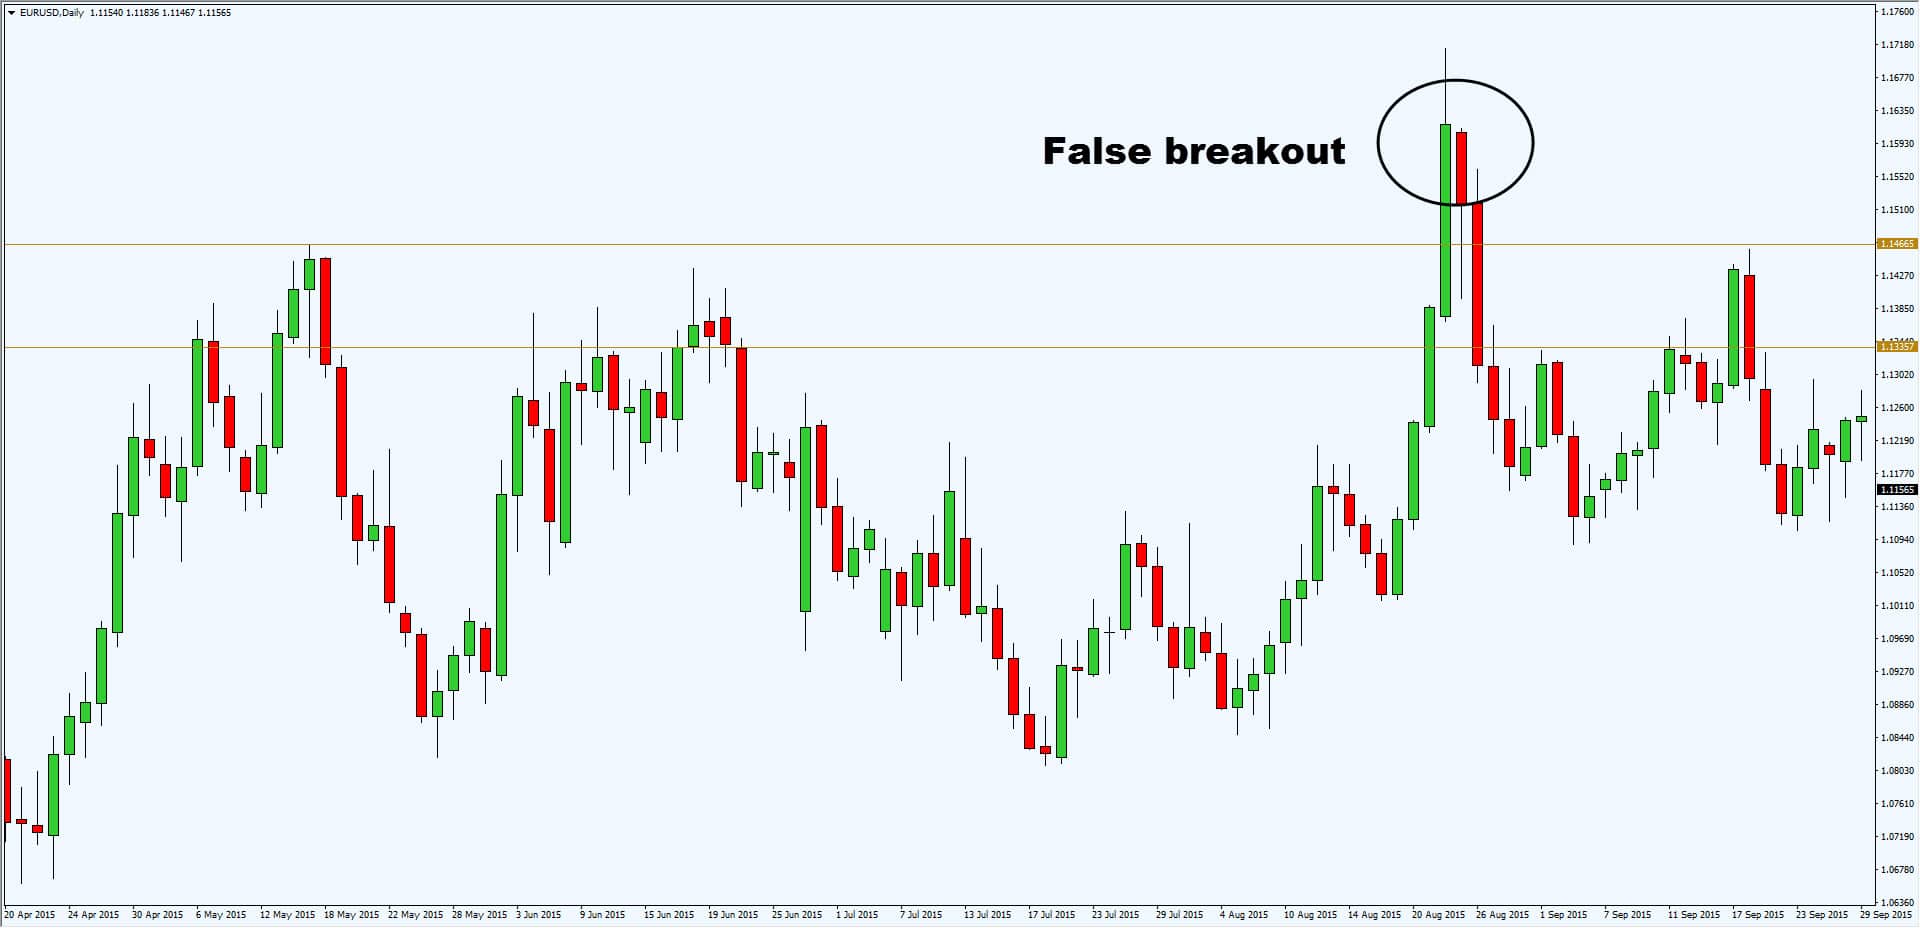
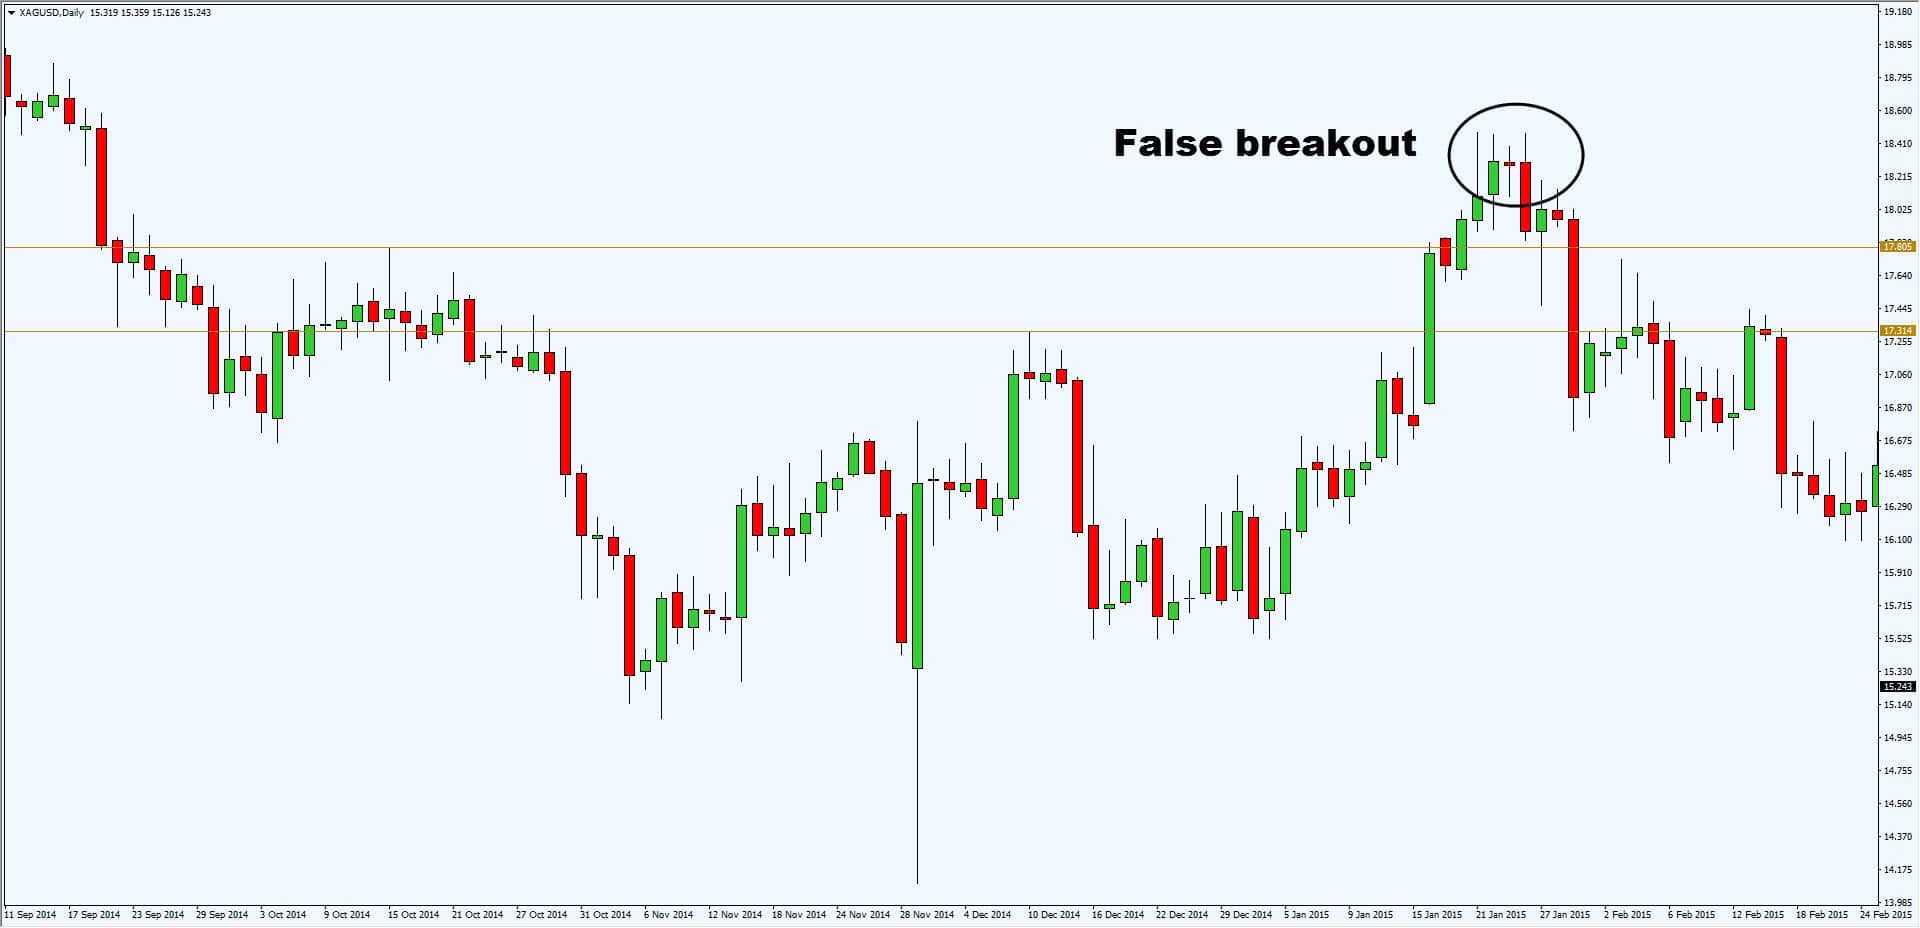
Why is this one of the best times to enter a trade?
Because you’re taking advantage of traders who are being “trapped”.
Imagine:
A trader, called Michael, went long on the break of resistance because
he expects a rally.
After a few candles, price traded against him and closed under
resistance.
At this point…
Michael is “trapped”. And chances are, there are many traders
like Michael, who took the same breakout trade and are “trapped”.
Now, a proficient trader can take advantage of this.
How?
By shorting the false breakout, with expectations that the
“trapped” traders would cut their trade, and fuel further price
decline.
And this my friend is the power of false breakout.
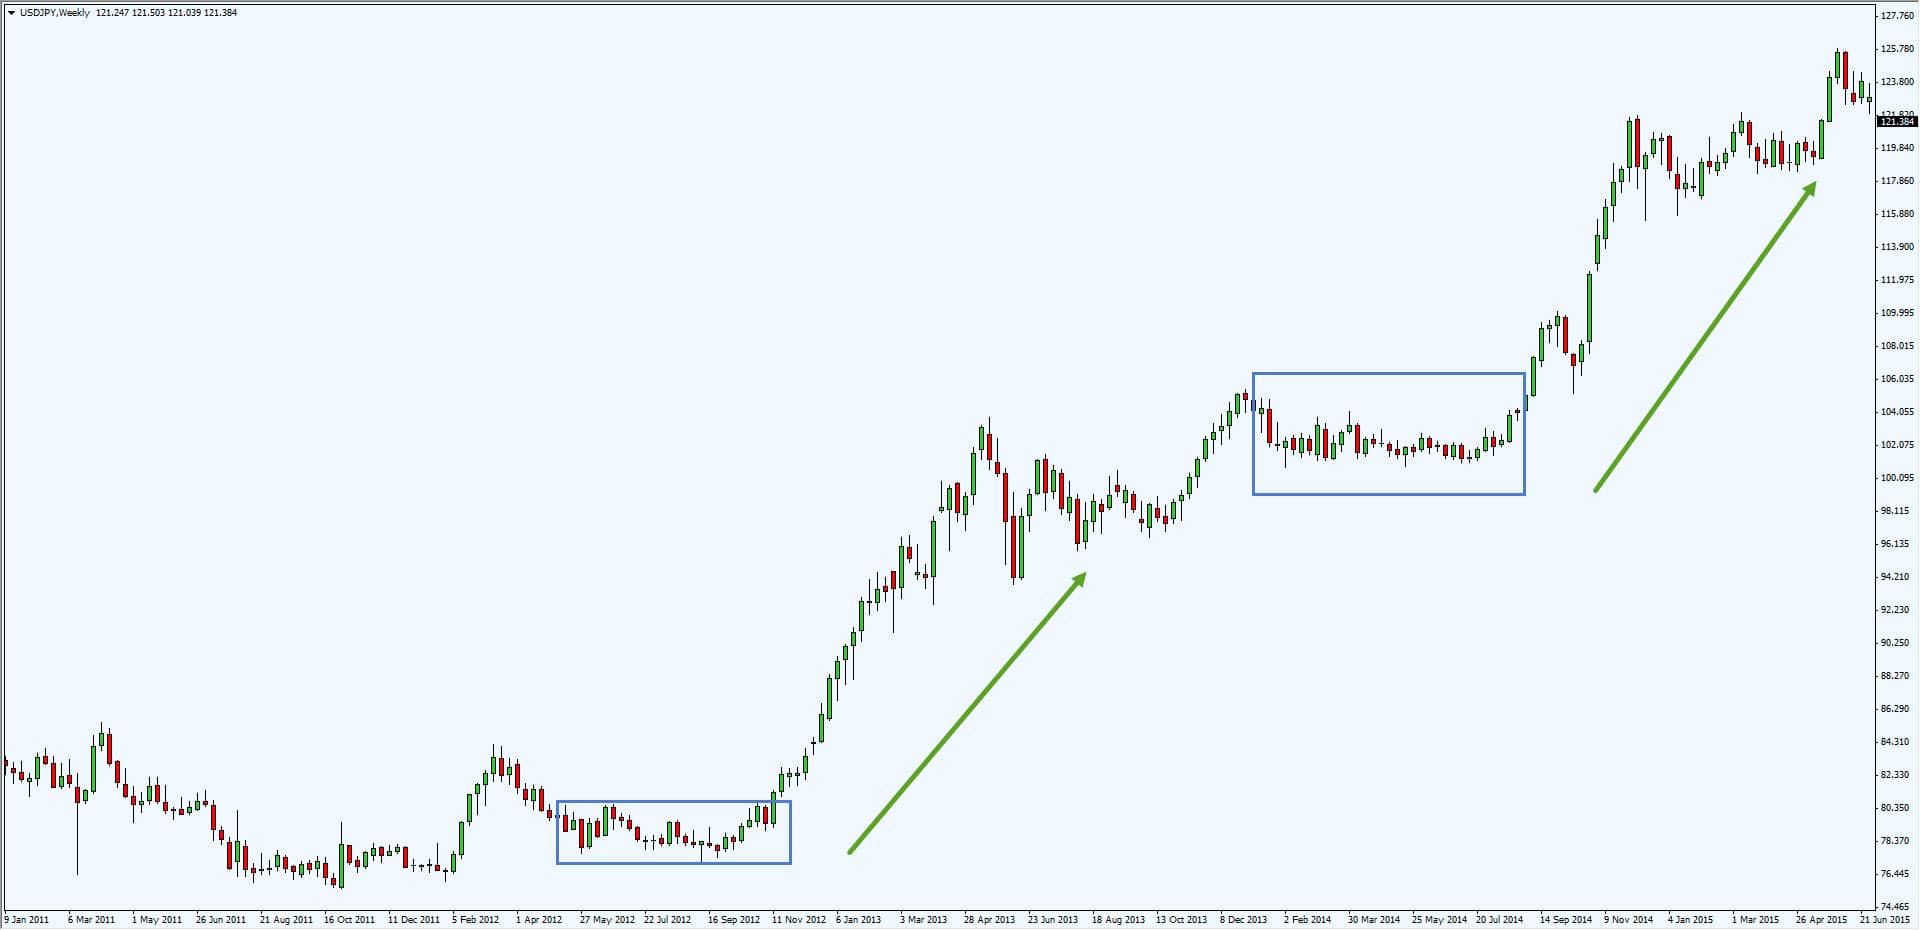
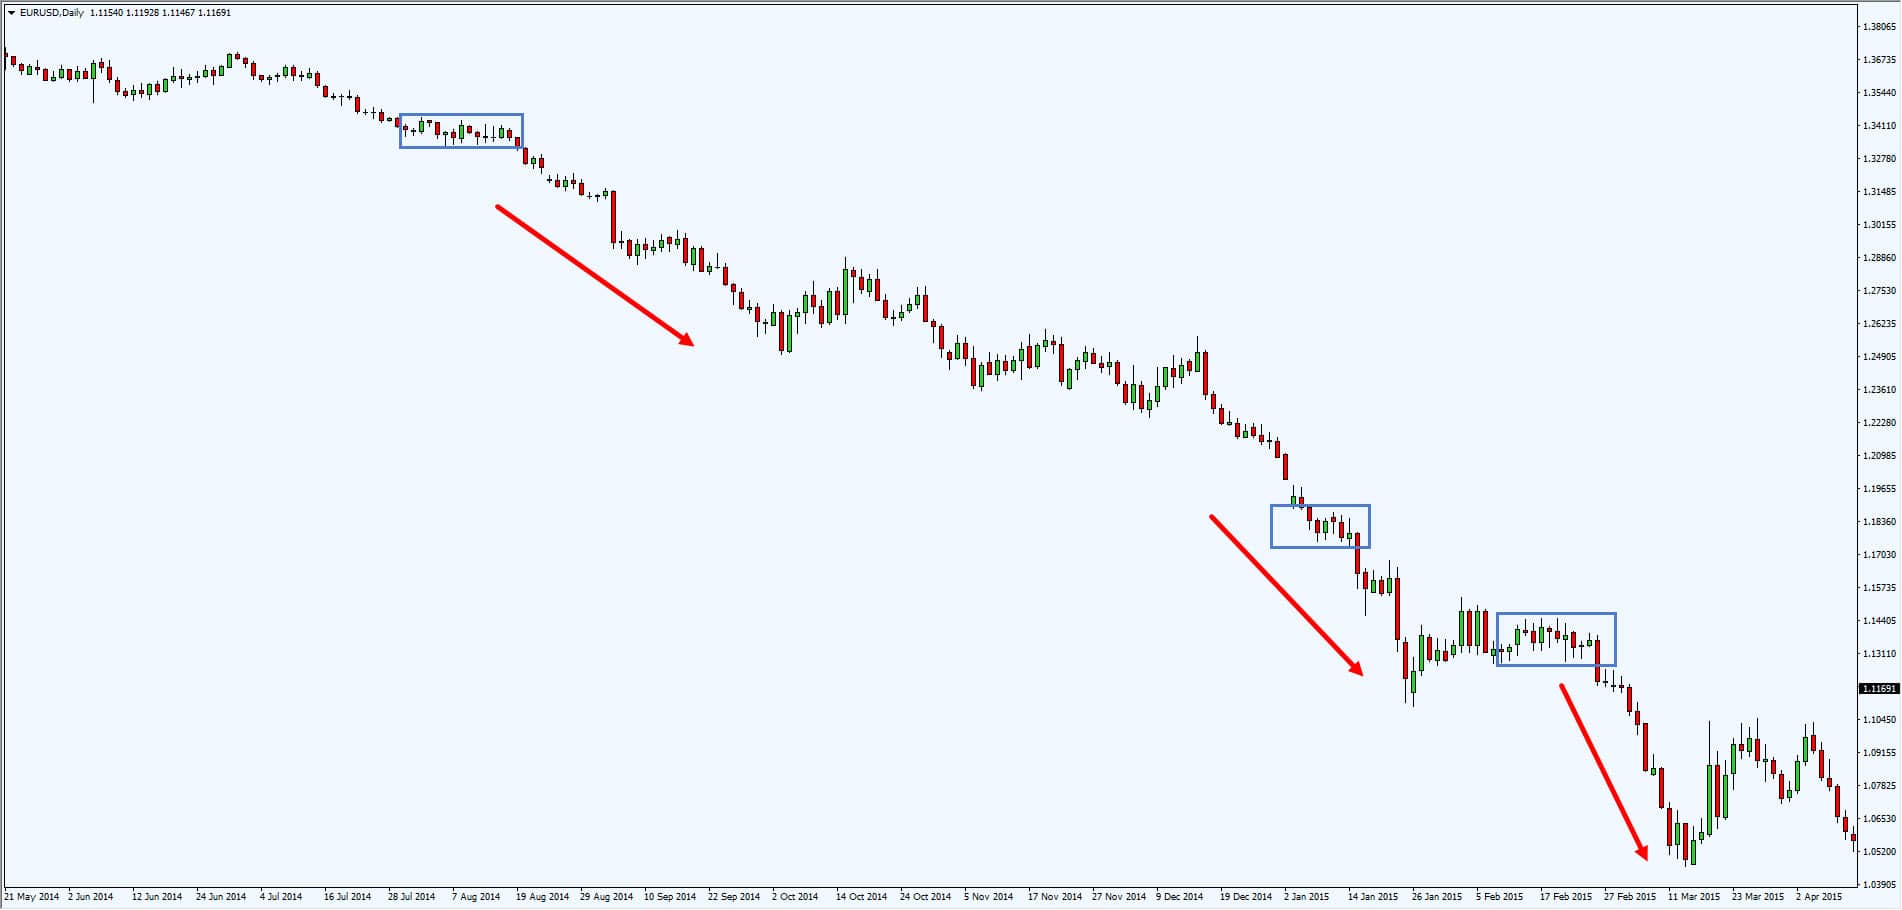
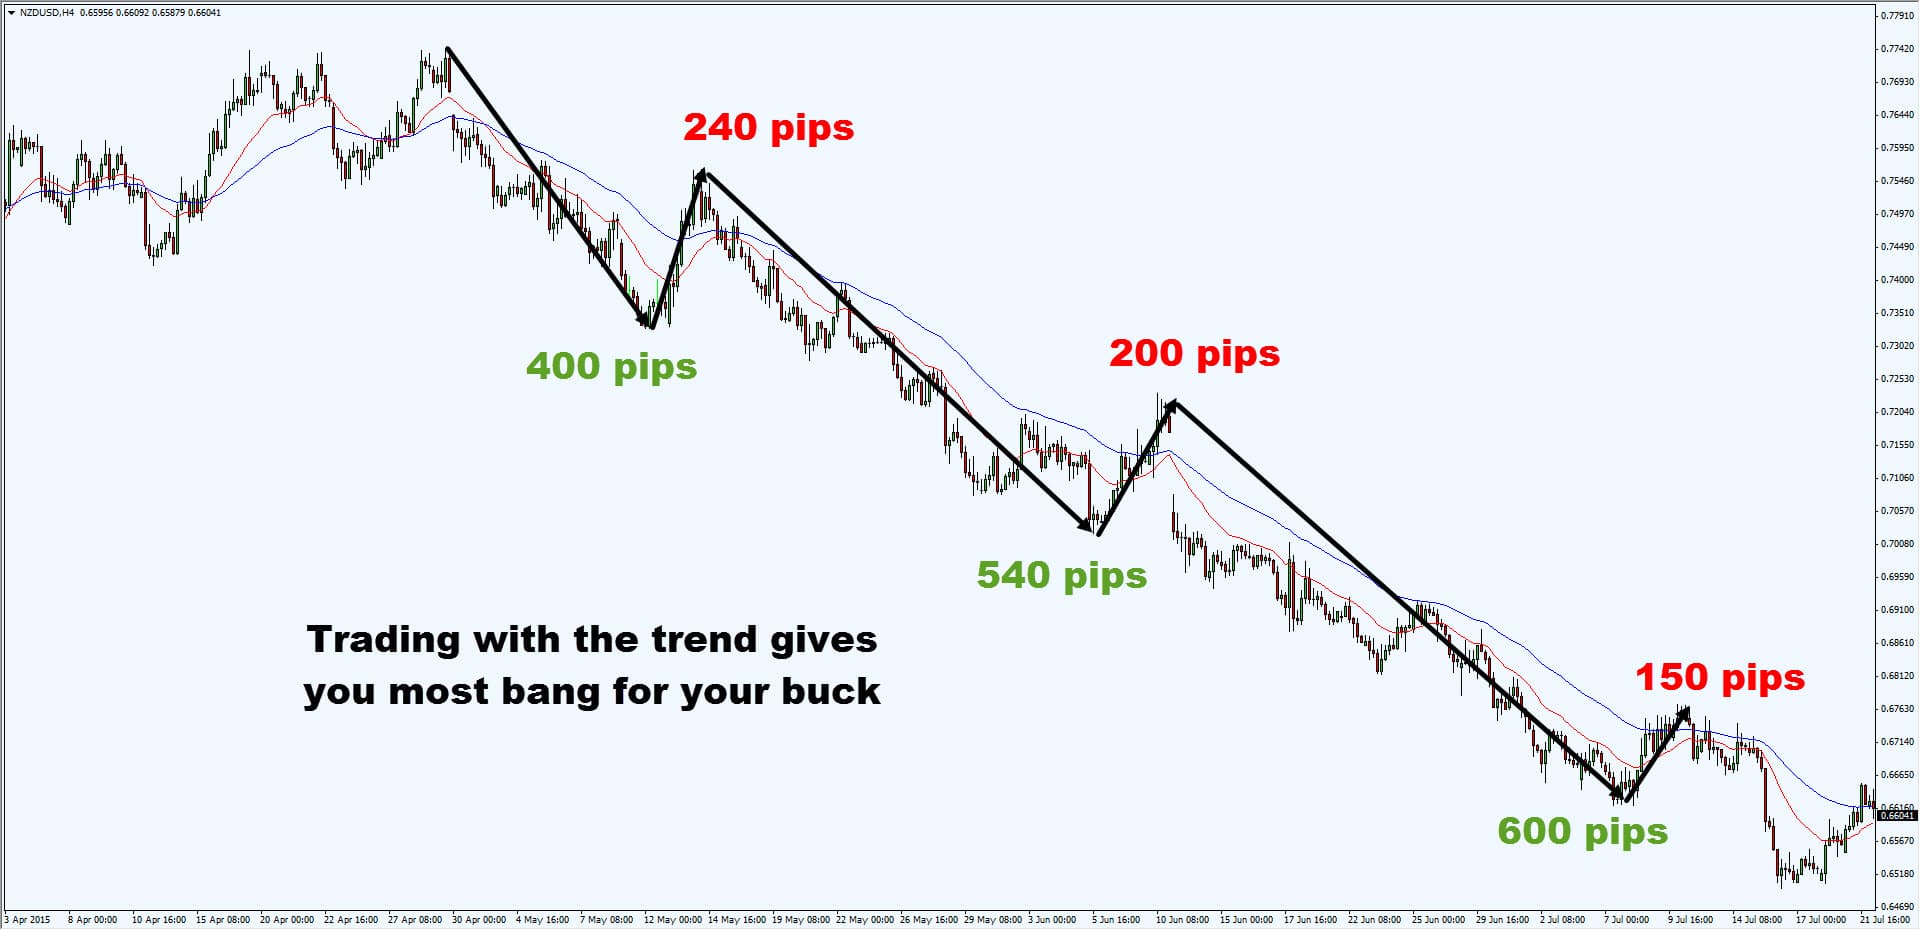
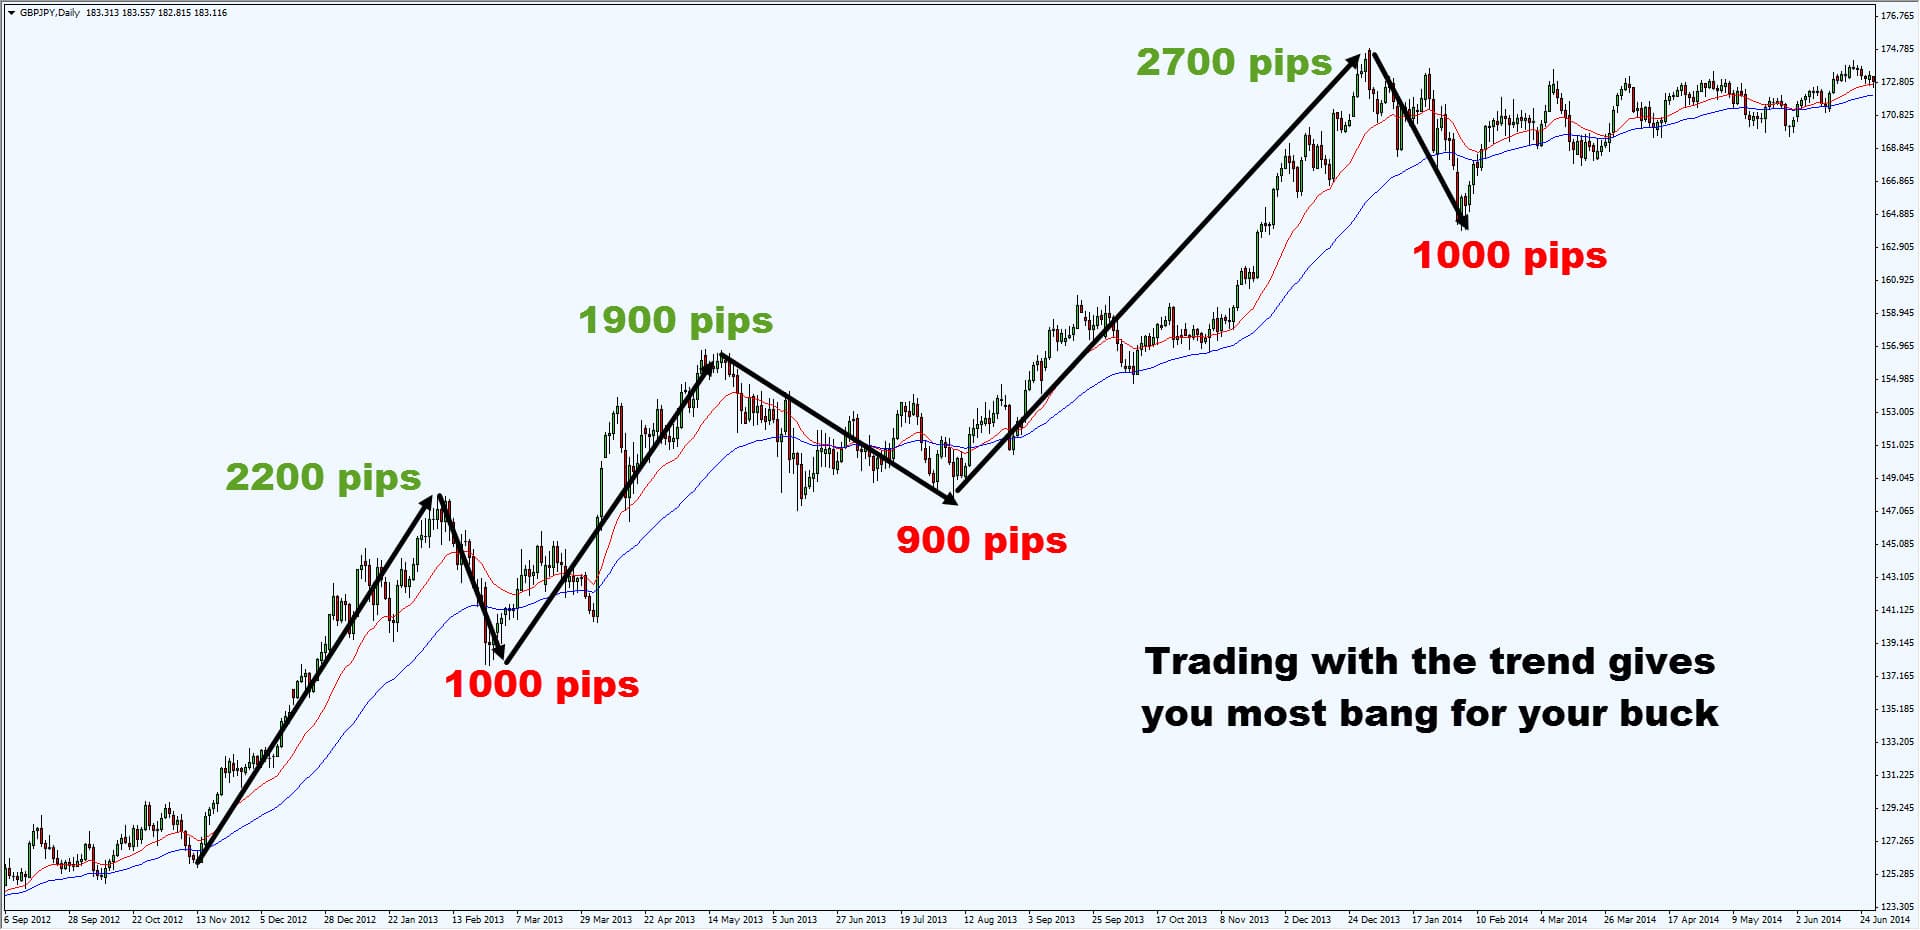
8. Trading with
the trend gives you greater profit potential
A mistake made by
many traders is that they become so involved in trying to catch the minor
market swings that they miss the major price moves. – Jack Schwager
One of the best ways to improve your trading performance is,
trading with the trend (and not against it).
This greatly increases the odds of your trade working out, and gives you
a greater profit potential.
Here’s what I mean…
Now…
If you want to learn how to define a trend, go watch this training video
below:
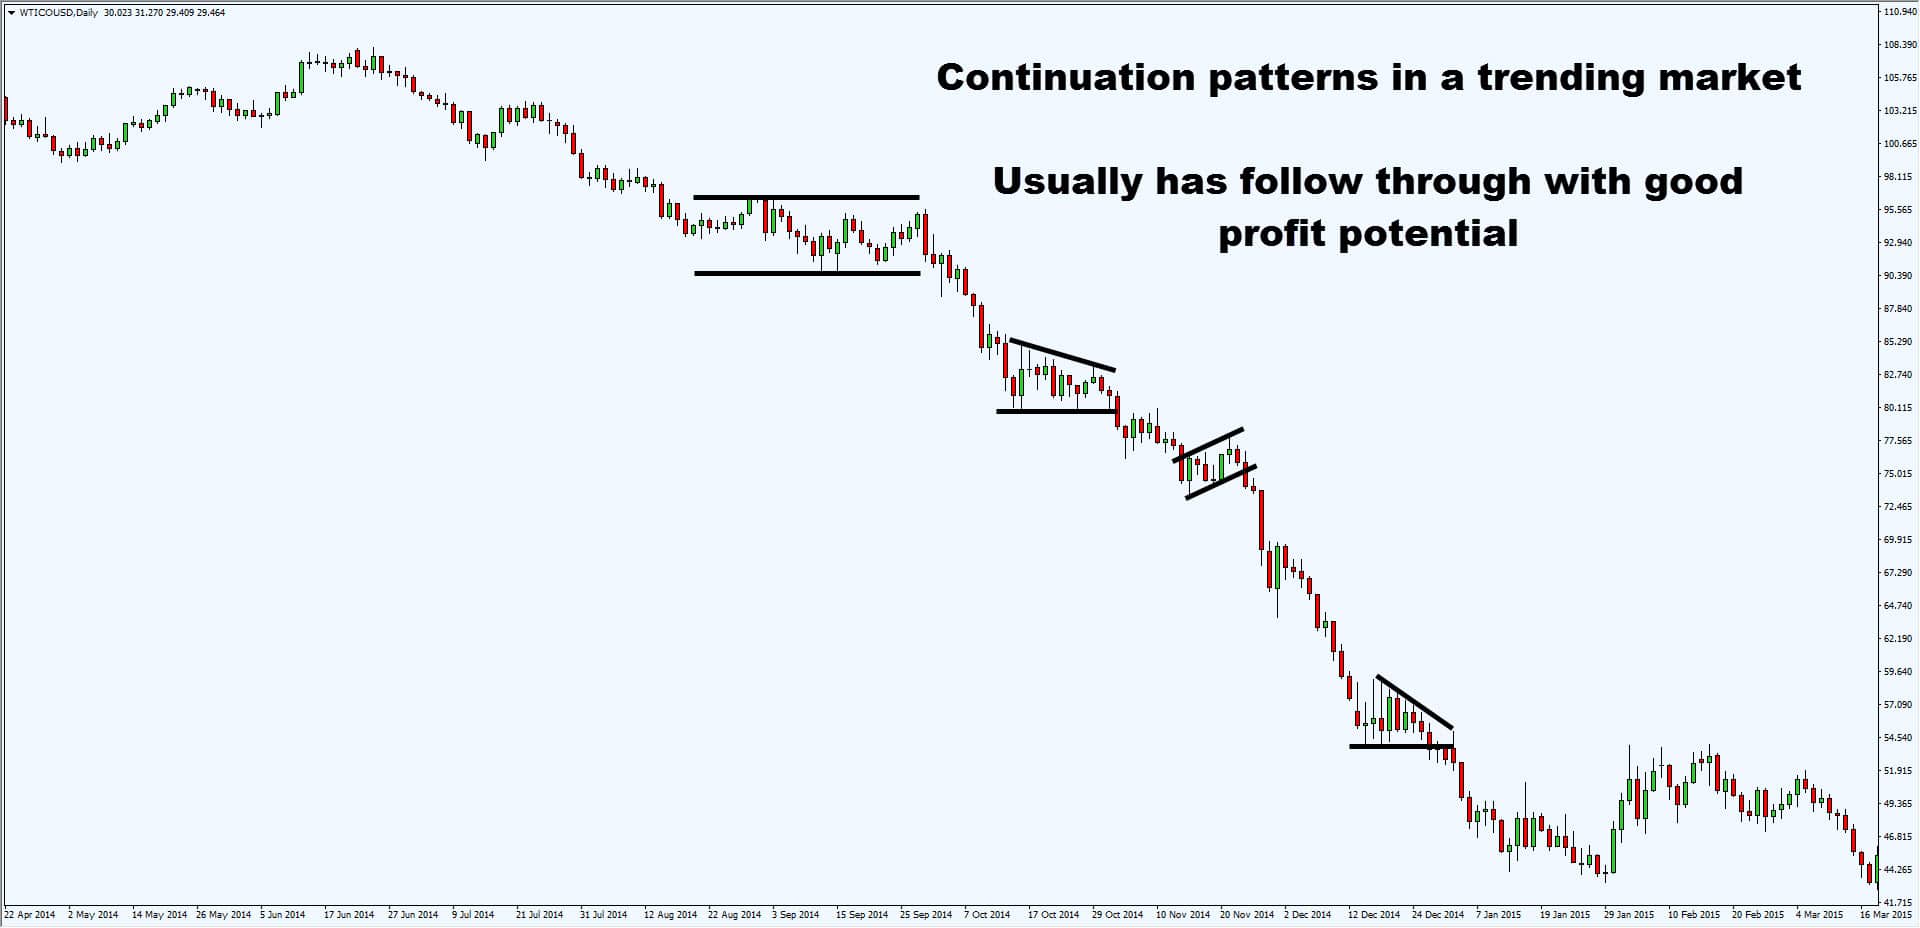
So, when is the best time to trade continuation patterns?
You guessed it, in a trending market.
An example:
Moving on…
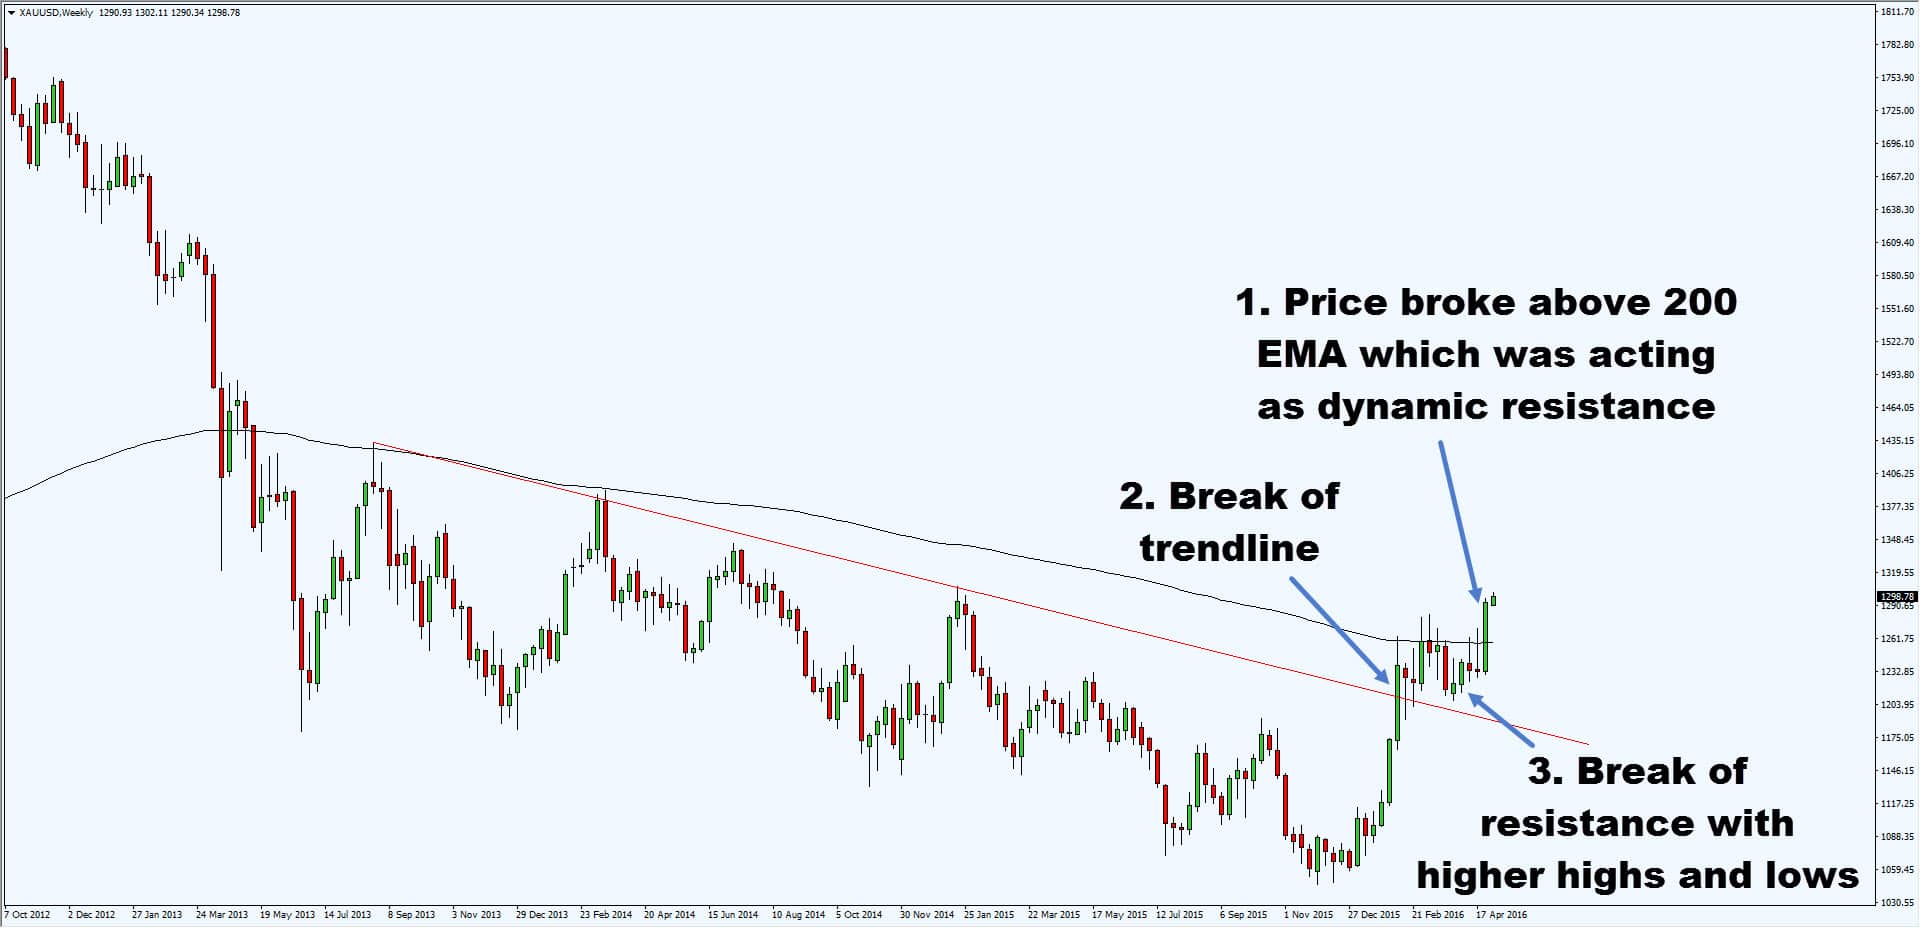
10. How to tell
when a trend is ending
These are 3 things I’ll look out for:
- A “respected” moving average
is broken
- Break of structure
- Break of trendline
An example:
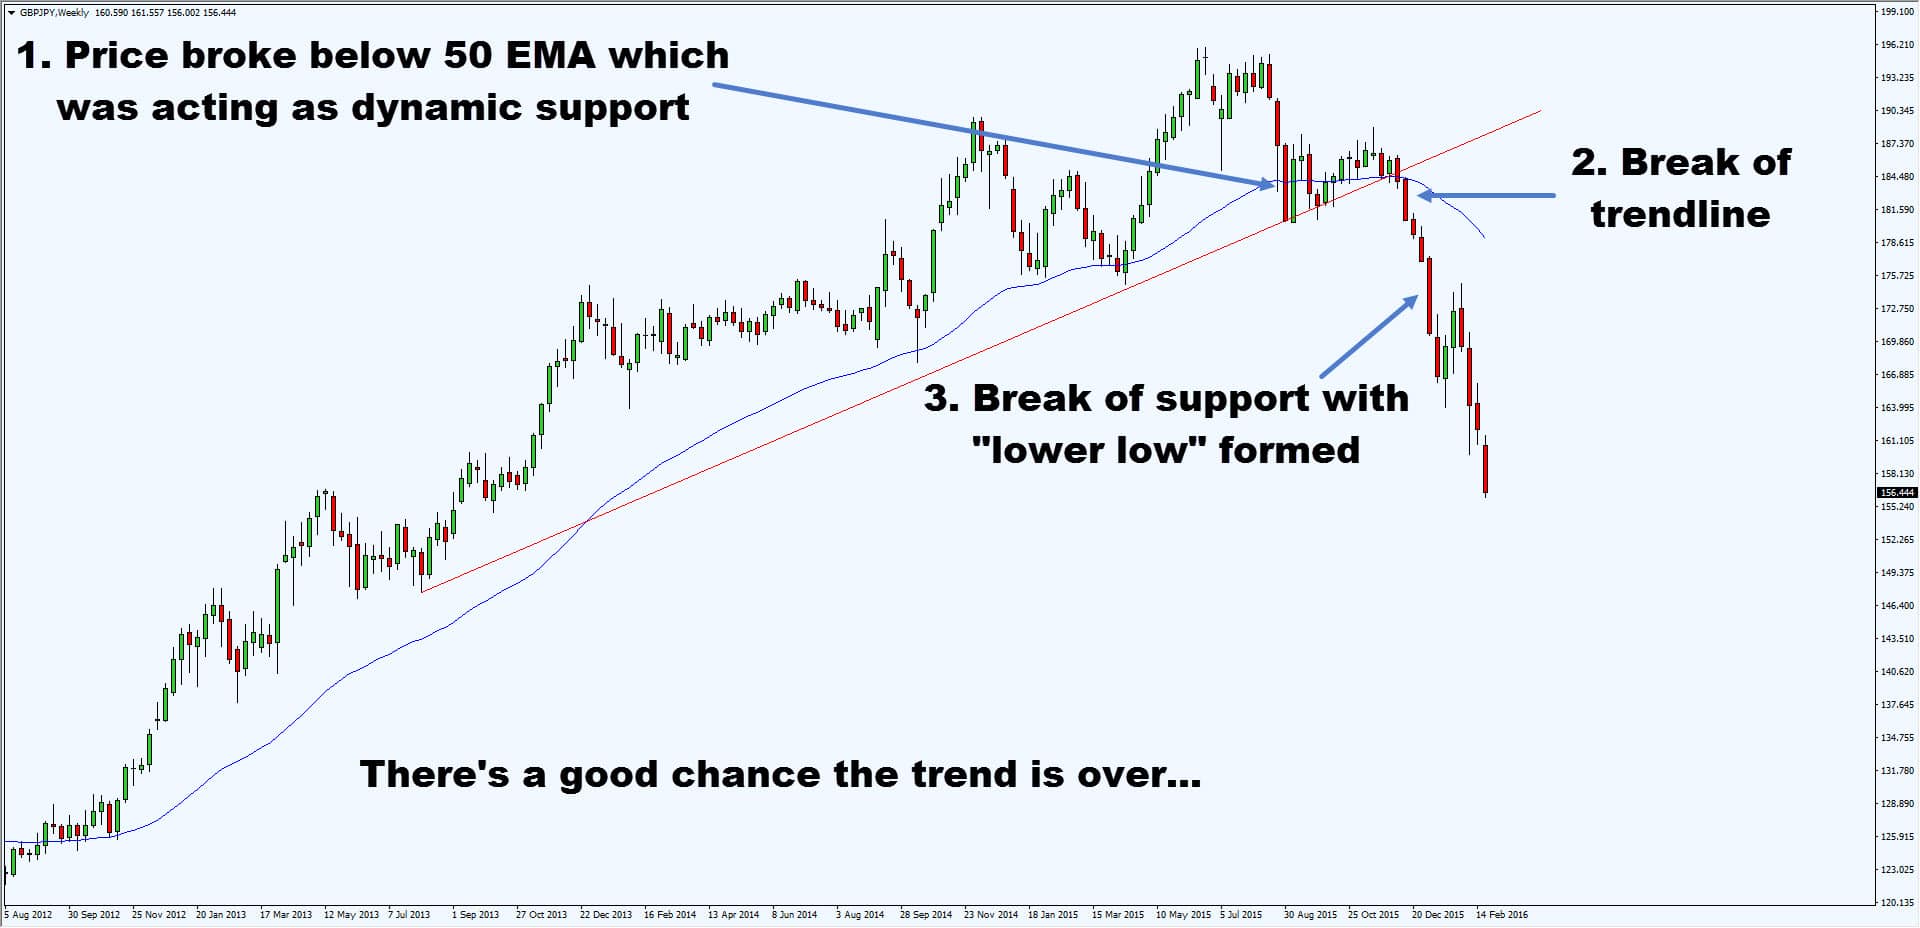
Let’s look it one by one…
1. Price broke and
closed below the 50 EMA, which was a dynamic support that has been
“respected” by the markets
2. Price broke and
close below the trendline
3. A new structure low
in the market is formed. Now you’ve got a lower high and lower low
When you’ve got all 3 factors lined up, it increases the odds that
the trend is over.
Here’s another example:
From http://www.newtraderu.com/2016/05/10/10-price-action-trading-tips-can-learn-10-minutes/
To recap, these
are 10 price action trading tips you’ve learned today…
- Avoid trading when the
market is far away from the moving average
- Support & resistance
helps you identify areas of value to trade from
- Trading at support &
resistance gives you favorable risk to reward
- The longer it range the
harder it trends
- Narrow range candles usually
lead to explosive moves
- Wide range candles
serve as “hidden” support & resistance
- False breakout provides one
of the best entry to profit from “trapped” traders
- Trading with the trend gives
you greater profit potential
- Continuation patterns
work best in trending markets
- A break of structure, trend
line, and moving average usually indicates the trend is coming to an
end
Packers And Movers Mumbai to Bangalore
ReplyDeletePackers And Movers Mumbai to Ahmedabad
Packers And Movers Mumbai to Jaipur
Packers And Movers Mumbai to Delhi
Packers And Movers Mumbai to Kolkata
Packers And Movers Mumbai to Chennai
Packers And Movers Mumbai to Hyderabad
Packers And Movers Mumbai to Bhubaneswar
This is a really nice post you shared, i like the post, thanks for sharing @ Packers And Movers Gurgaon
ReplyDeletePackers And Movers Gurgaon to Bangalore
Packers And Movers Gurgaon to Ahmedabad
Thanks for sharing.
ReplyDeleteBest Regards From Team,
Find More About Stock Market / Share Trading Information @ FinancialStockPrice.com
تنظيف مكيفات
ReplyDeleteشركة ترميمتسليك مجاري
مكافحة حشرات
تنظيف مجالس
عزل اسطح
Thank you so much for sharing this informative post. Really i got exact information what i was searching click here Free Financial Trading Tutorial
ReplyDelete