Tuesday, October 27, 2015

Discretionary and Systematic Trading by Andrea

There are broadly two types of trading: Discretionary and Systematic. Which one should I choose?
Here is the question, maybe the most important question about the approach to dedicate to trading. The question can even be deepened in other kinds of doubts:
  1. What does discretionary actually mean?
  2. What does systematic mean?
As much as I have learned about this I can say that both fields are huge, but there are clear boundaries dividing the two approaches. These clear boundaries are determined by the fact that if at the moment of placing the trade, the trader has to decide whether to place it or not, then he is trading in a discretionary mode.
Regardless of the approach, any market gives us signals to open or close a trade. These signals can come from an automated software previously programmed, from a chart setup drawn by the trader, or even simply by a feeling growing in the stomach of the trader. It doesn’t matter at a certain point a voice inside us is telling us to enter the market. If we can decide whether to listen to this voice or not, then we are discretionary traders.
So, let’s go deeper inside discretionary trading. Three main approaches build this field:
  1. The Video Gamer: Pure instinct based decision
  2. The Chartist: Method built upon observation
  3. The Trigger Puller: Decisions based on the feeling of the moment when an automatic signal is generated
The Video Gamer: The first group is the most aimed for by most of the people. Everybody hopes to be so talented that they can simply sit in front of a monitor, watch quotes going by, understand what should come next and, therefore, make their decisions in what direction to enter the market.
Sitting in front of a monitor and watching prices during the day actually helps in getting a feeling about the moves that take place; but to take a consequent action, and to manage the position going to be opened, is not as easy as it looks.
To be part of this group of traders, a real talent is needed and a very low percentage of people have this gift. Skills can be developed but some special cerebral fuel is needed to perform well in such a style and it is definitively not for everyone.
It would not be bad to use the markets as a video game; but as in video games there are incredibly talented guys and many others who are a real disaster.
We should not forget that as skilled as these players are; considering their usually young age, and youth helps in reaction times, concentration and velocity; getting older, it becomes harder and harder. The same would happen to these instinct based traders.
The Chartist: The second group of discretionary traders usually build a template with indicators or other similar things on which they make their decisions. Sometimes they display a simple moving averages crossover and sometimes they have complicated colored charts with dots and lines moving around everywhere (those are the "decision makers"). These charts are built upon experience and observation and often lead to pretty good results, if the method they are based on is strong. The problem is that it usually takes a long time to arrive to a good development of a decent model, and also a long time to decide if the model is really good. What this approach actually misses is a calculation of the expectation of the strategy. Everything is done by observing and very seldom by a real calculation of "how much" the strategy would have made in the last X years. The employment of a strategy is normally based on a very short period of observation and lacks in robustness and stability for the long haul. A good sensation can be acquainted by observing the behavior of prices over a certain period; but as this is done "manually", the period cannot be really long, and we can never be sure that the built method has always been working or that it will go on working for a long time.
The Trigger Puller: The third group has signal generators. Either of the above mentioned kind or real software popping up entry/exit information. Yet these traders decide for every signal if it makes sense to follow it or not. If the instruction in the signal does not convince their feeling of the moment, they don’t open the trade. In a similar way, when in a trade they decide to close it often too soon, as soon as they see a decent profit regardless of the structure of the strategy which would probably tell them to wait for an even bigger gain. And, on the contrary when losing, they may decide not to exit at the stop loss level as they feel confident in a bounce in prices.
These kind of traders are often systematic traders who have a lack of belief in their system and try to tweak it with their opinion. Sometimes their decisions are right but on average over a longer period, the human action on the machine generated signals leads to real disasters.
To sit in front of the monitor managing the trades may give the impression of keeping the market under control. It may let one think he is controlling his money, the prices and the profits, keeping everything under control like a juggler. This might even be true, but it is also clear to everybody how much concentration is a juggler needs...What these three approaches have in common is the necessity to be there and push the mouse button. The video gamer needs a very high and strong presence while the chartist and the trigger puller have a higher degree of freedom. Yet all lead to a high amount of stress due to their needs.
This is what I thought and think about discretionary trading, having gathered experience in the markets I sometimes place discretionary trades in a mix of all three approaches. It may be fun, it is a sort of new discovery. Yet, generally considering all the above mentioned reasons, I preferred to open my mind to trading systems. Results should have been easier, right?
I thought I was clever. I really thought I could program the best system out there simply because I was clever enough to achieve that.
I learned roughly soon how to program in TradeStation EasyLanguage and I also got enough data to start testing ideas. That’s great, to test ideas!
Yes, but what ideas?
A trading system all of a sudden appeared to be one of the most complicated experiences in life.
Where should I start from?
What should I do?
The first try to get out of the dark was mixing indicators to get signals, I read plenty of stuff on technical analysis and I read topics on well-known forums to figure out how to move. And then I started becoming desperate...
Why weren’t any of my ideas working?
and
What was wrong in my entries and exits?
And again
What approach should I try to get? At last, a profitable strategy?
So I looked for a trading system sold on the internet, they were presented in a very nice shape and they looked really complicated as far as what the underlying concepts were about. When I read those codes I thought I understood why my ideas were not working and I thought I had a lot more effort to put into the job. Those codes were really showing that trading is not a business for everybody, only a real scientist could achieve something!
Proudly I put those systems on the charts and there it was that I discovered the astonishing truth:
Those expensive systems, so complicated, did not make money. Exactly like my own ideas.
So I read again. There was an interesting concept that sounded very well in terms of development. Following that I needed a setup, a trigger and then position management; simple and direct, but
What exactly was a "setup"?
And:
What was a "trigger"?
And last but not least:
How should I manage the potential position?
Many years passed from those days and I might still be there looking for a solution if I had not met a friend who was already developing systems. He wanted to cooperate and gave me a very basic and stupid base code for systems, and this code had upset the concepts I had learned. It did not start from a setup and look for a trigger; it was starting from a trigger and then refining setups... crazy? Maybe, but it showed results and it was what I needed!
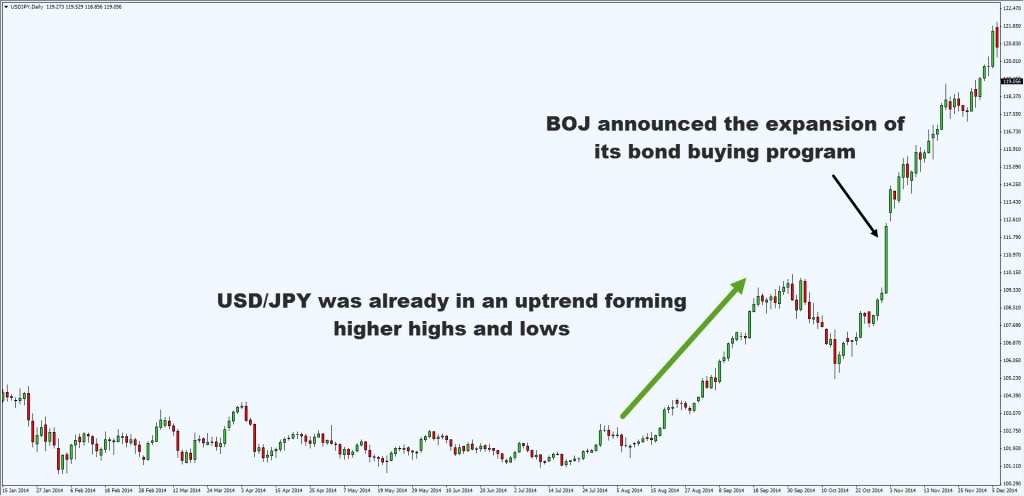
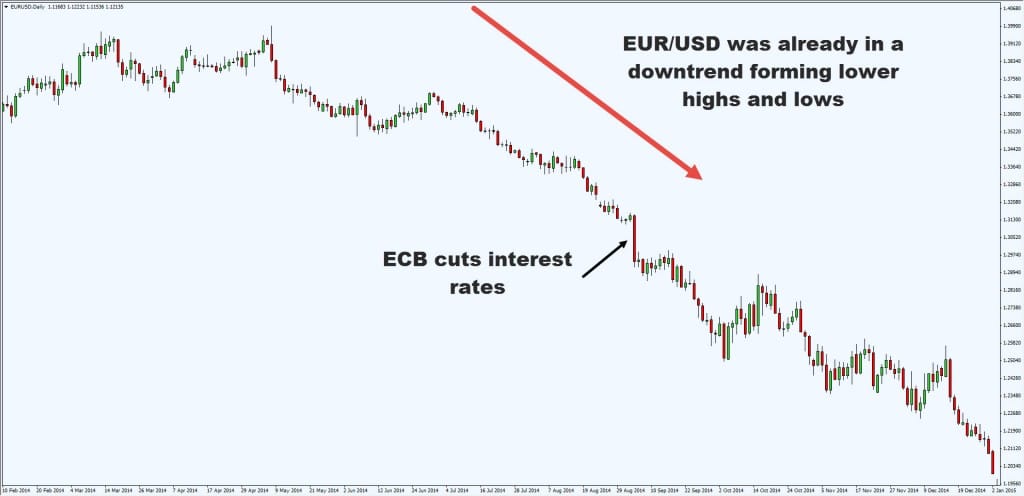
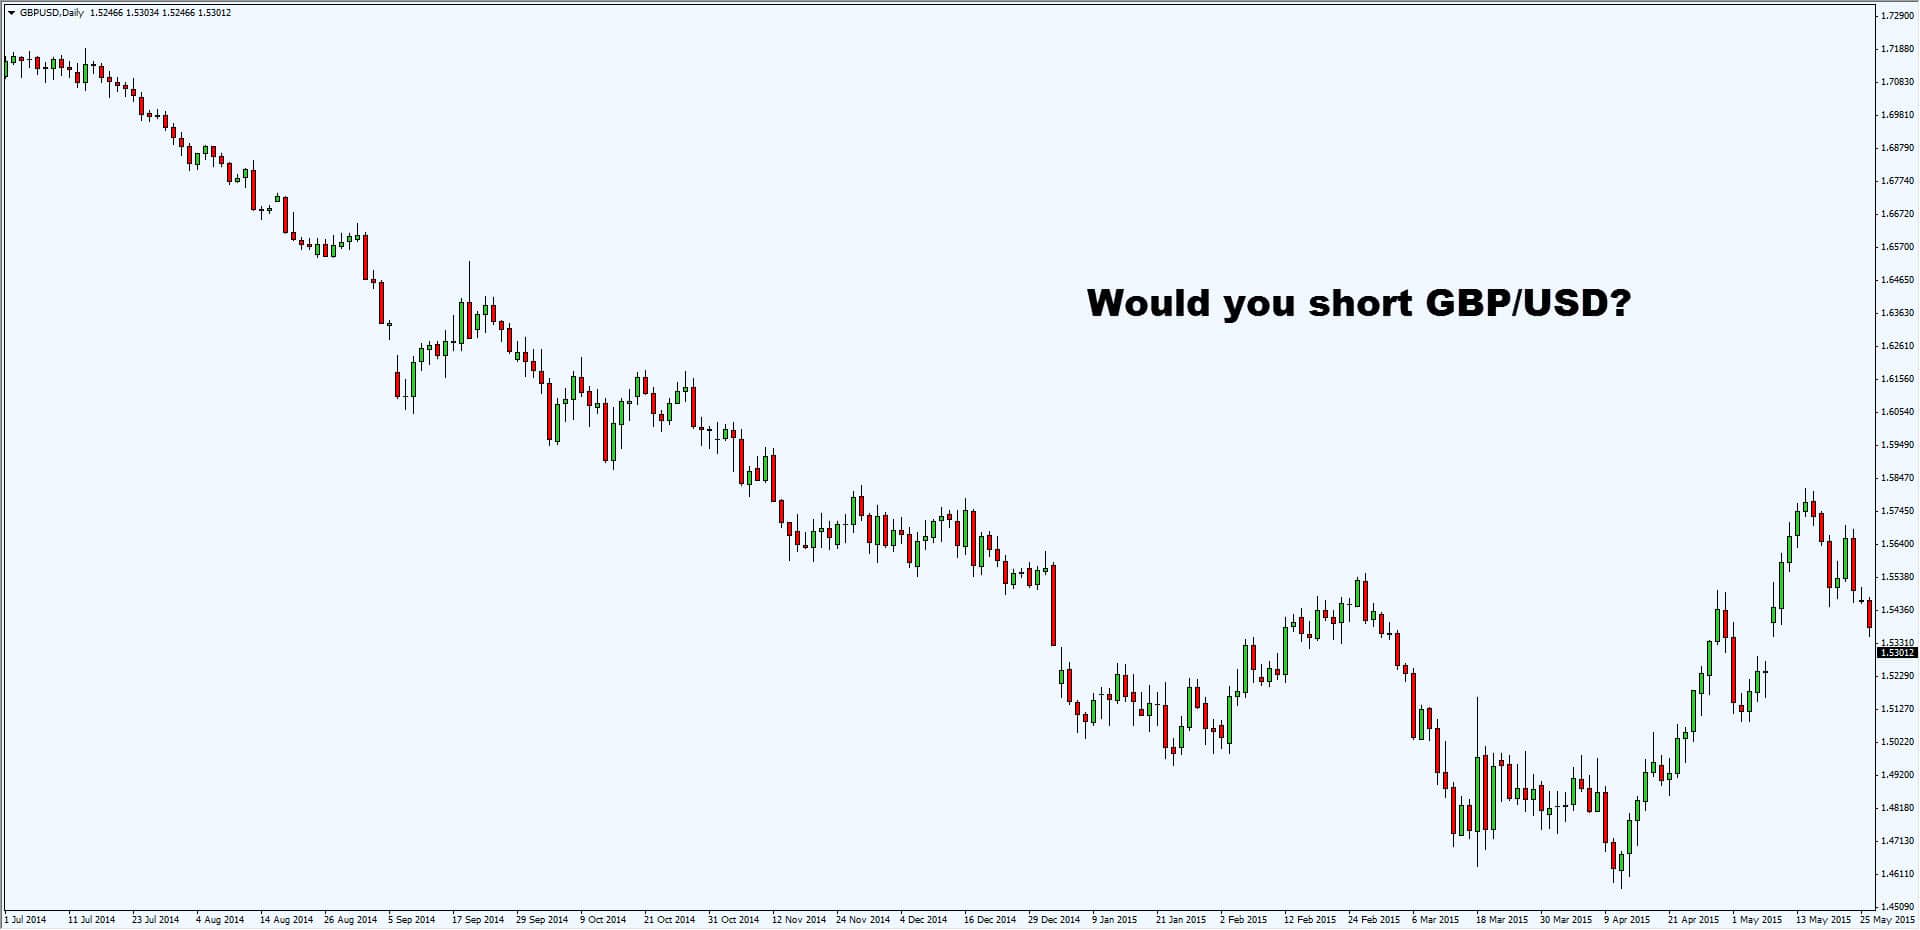
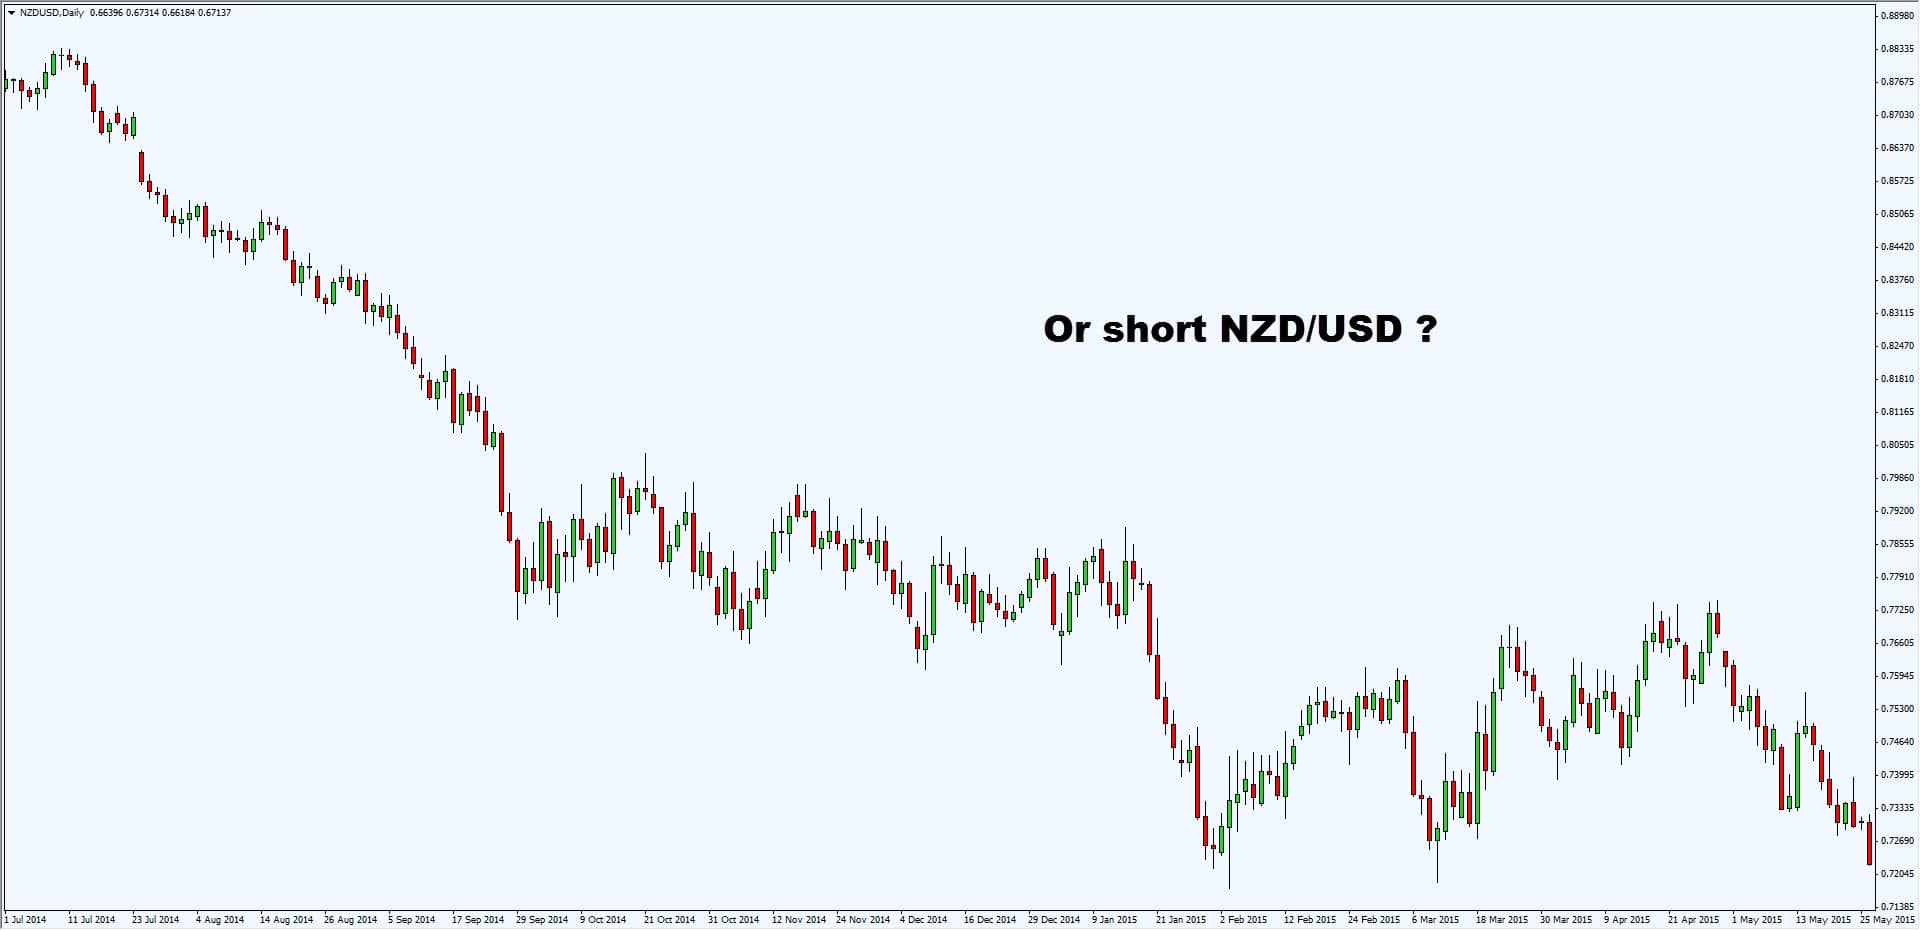
I went on deepening the matter and the first profitable systems came out, what an easy start! To buy or sell at the breakout of determined levels following a starting trend, simply buying at higher prices if prices were raising or sell at lower prices if they were falling... This was too easy to believe.
Maybe we are all born with a countertrend mind: when prices fall we think it is a good occasion to buy, when prices raise we stay out as they "went up too much." My friend gave me the exact opposite suggestion: "follow the trend!"
At last I had my first systems and I wanted to put them to work. I did, I also made some money, but nothing compared to what I could expect.
Why was I getting different results in real-time from what I was getting in testing? Suddenly I discovered the truth of markets. Theory said that "limit orders" have no slippage and "stop orders" can be executed with slippage. I discovered how you could get more slippage with limit orders than with stop orders. This was not possible in my beliefs as the concept of "Limit" and "Stop" was clearly following the learnt theory. But this is just a limited point of view and experience showed a really different truth.
Then I found out the limitations of the software. Lack of proper information may lead to a bad back-testing, usually more optimistic than reality, and real-time will show the worse side of the coin.
Working on higher time frames without intrabar information is a sure way to overestimate the results of a system. Many unknown tricks were played to me from the computer itself and I was fooled by the numbers.
Last but not least, the theory of back-testing showed a perfect world where every trade had been taken: what a difference from real life! Connection breakdown, broker’s technical problems, high latency in sending the order, these are just some of the obstacles encountered with real money. And as to Murphy’s Law:
"You will miss only the winning trades, losers will all be taken!"
So these were some examples of the passage from theory to practice. Real trading practice let things be considered in their real contest and I was able to figure them out correctly or at least "honestly". I could now make money but less than what the theory expected..

Monday, October 26, 2015

What is Harmonic Trading Pattern?

Price action and high probability pattern trading are two defining characteristics of Harmonics. Based on the geometrical shifts in Fibonacci angles, Harmonic trading patterns have long been used to identify reversals in a trend.
Depending on the distance from the previous high or low point within a range, the change in price can be predicted with almost 60-70% accuracy. Please note that this was the estimate given by website harmonic-trader.com. These percentages can be greatly exaggerated and are subject to a variety of factors including risk and money management.

Fibonacci

The important questions that need to be asked when analyzing the viability of harmonics is how they are calculated and why are they assigned a high probability label. One of the key components of harmonic trading is Fibonacci.
“The Fibonacci sequence of numbers is as follows: 0, 1, 1, 2, 3, 5, 8, 13, 21, 34, 55, 89, 144, etc. Each term in this sequence is simply the sum of the two preceding terms and sequence continues infinitely.” (Investopedia,2013)
The traditional mathematical formula has been adapted to trading to identify levels of support and resistance within a given range. Harmonics use the sequence to calculate whether there is potential for reversal in the price.

Different Types of Patterns

Harmonic trading patterns
Harmonic trading patterns are mathematically based and have different probabilities of success
Source:  http://fib618.wordpress.com/fx-strategy/harmonic-patterns/
  1. AB=CD
  2. Bat
  3. Butterfly
  4. Crab
  5. Gartley
  6. Shark
  7. 50
  8. Three Drives
Each of the above patterns will be analyzed in detail in follow up posts.

Advantages

  • High Probability
With a high success rate, Harmonic trading is increasingly becoming popular with retail traders. As it utilities mathematics and geometry to determine entry and exit points, there is little room for error. It is important however to choose the right pattern and not overtrade. Although there are a number of different setups, the high probability patterns include the Gartley, Crab, Shark and AB=CD.
  • Trend Reversal Forecasting
Another key advantage of Harmonic trading is its trend reversal forecasting capability. In essence, a trader can see whether or not a price movement is at its beginning or end. Once again it is dependent on the choice of harmonic pattern. Traditionally hedge funds that trade on exhaustion (overbought or oversold) situations will use harmonics as one of their many tools to identify reversals.

Disadvantages

  • Complex
Setting up a chart to identify harmonic patterns can be quite complex. As they are based on mathematical and geometrical calculations, a normal trader would not be able to identify a pattern without using an indicator or overlay chart.
  • High Risk
Harmonic Trading can involve significant risk if not managed effectively. As the patterns attempt to identify reversals in a trend, they can sometimes be too early or incorrect. This can lead to the trader betting against the market and momentum. It is always important to impose strict risk and money management rules.
  • Curve Fitting Results – Back test
Hindsight can be a beautiful thing in most cases, however when it relates to harmonics it is not. Curve fitting can occur when back testing harmonic patterns. This is due to the fact that a trade setup may have existed at the time, however the trigger will not show in the back test, as the trend has continued and broken down.
To reduce such risk, it is important to stress test using out of sample data. This can be done by choosing random and specific data ranges, and testing the performance for that period. If the success rate or figures are completely different, then it is curve fitted.

Charting

Following on from our previous comment pertaining to high risk and complex, charting harmonic patterns can be challenging for most traders. It is almost impossible to identify trade setups without using a predefined layover chart or indicator. Remember, timing and execution efficiency are key in harmonic trading, hence the requirement for a mechanised system.
For a harmonic indicator and expert advisor, please contact one step removed.

Risk Management

A common risk management technique to adopt when trading harmonics is the 1 to 2 risk reward. The reason for this choice is the level of risk. Harmonics can be great at picking reversals in price, however when they breakdown, they can be very ugly indeed, and can cause significant losses. Once again an automated system that sets specific stop loss and take profit levels would reduce this risk

Thursday, October 15, 2015

7 Lessons I Learned from 7 Years of Trading by TradingWithRayner

Wednesday, October 14, 2015

The Real Logic And Nature Of Stop Loss Orders

The Real Logic And Nature Of Stop Loss Orders 

A stop loss is not only one of the most important things a trader has to have, but executing it the right way and understanding what a stop loss actually is, is critical for trading success. Misunderstanding the logic behind a stop loss order will be disastrous for a trader. Revenge-trading and moving stop loss orders further away when price goes against you are just two of the trading mistakes triggered by a wrong belief about stops. Those mistakes are often the cause of significant losses for amateur traders and the reason why it is important to take a closer look at the logic and nature of stop loss orders.

The one and only thing that a stop loss order really should be

This is the cause of all problems with stop loss orders. A stop loss order should be placed at a price level where it cancels your trade idea and where your anticipated trade scenario is invalid. This is the one and only reason behind a stop loss order. However, most traders follow a wrong and dangerous process. First, amateurs identify a trade entry, then they look for a potential profit and finally they choose a random stop loss level that allows them to trade with a decent reward:risk ratio and enables them to potentially achieve a certain profit. This could not be more wrong because it shows a complete misunderstanding of the nature of stops. A stop loss order should be placed at a price level where it cancels your trade idea and where your anticipated trade scenario is invalid. Not at random price levels that enable a certain profit.
stop_loss_order
The optimal process of placing a stop loss order

wrong_StopLoss
The wrong approach that most traders follow when it comes to stop loss placement

A trading scenarios and stop loss placement

First, a trader should have a trade idea in his mind and in his trading plan. Then he looks for a price level that would cancel his trade idea. For example, if you want to enter a long trade after a bounce off a double bottom, you have to define how much room you are allowing price to penetrate the double bottom. Below this point, you set your stop loss because it would cancel your trade idea. The screenshot below illustrates the scenario. The green shaded area represents how much you allow price to go against your trade and where you still believe that your trade idea is correct. When price enters the red area, it has moved too far and a buy trade is not the right option anymore because it signals that a bounce off the support and previous low is not a reasonable assumption.
stop_loss
Stop Loss – Valid vs. Invalid trade idea – click to enlarge

Nobody cares about your entry

This point is a continuation of the previous statement. The reason why traders believe that their trade idea is still valid, even if price exceeds their stop loss level is because they overestimate the importance of their entry price. Just because traders don’t want to realize a loss, they hope that price will turn around and go back to their entry. At this point, they are trading completely based on hope and emotions and have completely forgotten about their original trade plan. If your original trade plan was to buy a bounce off support at a previous low, then you should never forget your plan! Never! A price that goes too much against you, signals that your idea is not working out and that support is not holding. If price eventually turns, it has nothing to do with your idea or price support anymore and you should be out by then.

What moving a stop loss means

A common mistake is that traders move stop loss orders further away once price moves against them. However, this means that now price has to move even further so that you can make a profit. Looking at a trade that is going against you from this perspective often makes it much clearer why moving a stop loss further away is such a bad idea. Not only can you now realize a much greater loss, but your trade now has to move much further in order to make any money. The screenshot below illustrates the concept. The trader initially bought at previous support and anticipated a bounce and a price move higher from there. The initial stop loss (1) signaled where his long trade idea would have been invalid. Remind yourself, when price reached his stop loss level, it would have signaled that he does not expect price to go to his take profit order anymore. However, he decided to widen his stop loss order (2). Now, once price keeps going down, the distance between current price and the take profit order increases significantly and although his original trade idea was bullish, the overall chart looks very bearish and a price move all the way to the take profit order is very unlikely and not in line with his original trade idea. The idea is that when price reaches your stop loss level, you don’t expect it to go to your take profit order anymore. Staying in a trade that goes beyond your stop is not based on sound trading principles and a trading plan. Always keep this in mind when engaging with your stop loss order. 
stop3
Stop Loss Widening – What it means for your trade – click to enlarge
Ask yourself the following question before moving a stop loss order: If you were not in the trade already, would you do it all over again with a stop loss at the price you are about to set it to? Most of the time, the answer is no and you are better off by closing the trade and re-evaluating the scenario. Being in a trade often clouds our decision-making process because we are emotionally attached to the trade. Try to avoid such scenarios and always stick to your stop loss order.

What do you want to do next?
Before bear_circle Next
Previous: Take profit and dynamic risk:reward ratio Back to the overview Next: Advanced stop loss 


Monday, October 12, 2015

The 7 Rules For High Probability A+ Trade - Checklist

The 7 Rules For High Probability A+ Trade - Checklist by www.ForexSchoolOnline.com

www.ForexSchoolOnline.com CHECKLIST 7 Rules to a High Probability A+ Trade - CHECKLIST

The checklist is below; Below the checklist is a detailed explanation of each point. You can also download the checklist by itself at the bottom as a PDF to print off and put beside your computer so that before each trade you can quickly run through the checklist and tick off each box one by one. Make sure you read through to the end of this lesson because I am going to show you how to make your own checklist and the tools you need that easily let you do it.

#1.  Is Price at a Major Support or Resistance Level?
#2   Is There a Compelling Price Action Story to Make the Trade? 
#3   Is Price at a Swing High or Swing Low? 
#4   Is Price in the High Volume Session for this Market or Pair? 
#5   Is This Trigger Signal Buying Low & Selling High or Vice Versa? 
#6   Is This Trigger Signal Large & Commanding? 
#7   Is There Space to Trade Into, and Have You Written Out Your Pre-Trade Plan? 

Like everything I do in my trading, my checklist is no different in that it is both simple and effective. The order that I have built it starts at what I class the most important factors for finding a high probability trade. The reason for that is because if I do not get these really important checks met, then I can just move on. I don’t have to go through all the other checks on the list just to waste my time and work out that the setup is a dud anyway. I can get to point one or two and move on. For example, it is crucial that price forms at a major support or resistance area and that there is a compelling price action story to make the trade. These are points one and two on the list. If however, I have these down at five and six; for example, and my number one point is “Make Sure The Price Action Trigger is Large and Commanding”, then I will find a really great trigger signal that meets all the rules, which is great, but I am not going to work out that it is not at a major level until I have gone through all the other checks and wasted my time. I did not have to even look for a trigger signal. EXPLANATION

EXPLANATION 1. Is Price at a Major Daily Support or Resistance Level?
This, and point two, are the most important factors in hunting any trade for me, and so when looking for a high probability A+ trade setup, this is the first check-box I look to get ticked off. The reason I look for a major daily support or resistance level first, and not the trigger signal, is because where price forms is the key to a really high probability trade setup and price moving in our favor. Whilst the trigger signal is very important to a successful entry, it is only the last candle on a chart that has many candles on it. Price moves because of supply and demand and major support and resistance levels are huge areas of supply and demand. We want to be trading away from these areas where a lot of order flow is going to be giving price a huge boost. Once we have found a major level on a chart, then we can start looking at other factors.

2. Is There a Compelling Price Action Story to Make the Trade? Hand in hand with the major daily support or resistance level is the price action story. What exactly is the “Price Action Story”? The price action story is putting the whole price action chart together to read the overall story. Instead of just reading a pattern or instead of just trading the last candle, we are looking at the whole price action story. What type of things should we look at for the price action story? Basically, everything. You want to look at things such as: Is the market trending? What type of market is it? i.e. is price consolidating or ranging? or is price winding up into a tight box with inside bars? This can be super important for not only finding a trade, but trade management. Is there any Very Big Round Numbers (VBRN’s) around? Is there space for price to trade into when it breaks? Or is there a lot of traffic and minor support and resistance areas? Where price can and cannot close tells us a lot. I have linked a lesson about this at the bottom in the related lessons, but where price closes is very important. What has been happening in the recent price action? i.e. has there been a 1,2,3 reversal? Has there been a lot of strong momentum candles? etc. You can see from the examples above that we are looking at everything and ALL of the price action to put the whole story together. EXPLANATION

EXPLANATION 3. Is Price at a Swing High or Low? 
This is crucial for all reversal trade setups and one of the biggest mistakes traders make with reversals. I cannot stress how important this point is! If a reversal is not played from the correct swing point, then nearly almost every time it will always be trading straight into the recent swing support or resistance and the trader will be entering the market just as the big guys are getting out. This is super important and that is why I go through for you how to make money with reversal trade setups at the correct swing point at: www.forexschoolonline.com/make-money-trading-reversal-signals/

4. Is Price in the High Volume Session for this Market or Pair?
There are far better times to trade certain markets or Forex pairs than others. This is super important to keep in mind when looking to enter a trade setup, especially on the intraday charts because there is the risk of making a trade and having that trade being taken out with a false break. There is not one rule or time for all markets because all markets are slanted toward different countries or zones. For example, it would not be advantageous to trade a Forex pair, such as the EURUSD during the Asian session on the intraday charts because both Europe and the US would be closed and asleep and any trade entered during this time would run the risk of being stopped out when the European market opened. A Forex pair, such as the AUDJPY during the Asian session would be fine to trade however, because both the Aussie and the Japanese trade during this session, and so both are active.

5. Does This Trigger Signal Meet my Basic Criteria?
This check-box seems like a super simple check-box to have in here, but the reason checklists, trading plans, and standard operating procedures work when built and then followed by those organizations who have them is because they create a system to be followed where success starts to be consistent and ingrained. EXPLANATION EXPLANATION On the other hand, other traders (and other organizations for that matter) are doing things by the fly and the seat of their pants - you have a set system for success. You are not taking a chance that you may accidentally get into a trade that does not meet your rules because in order to put a trade on, you need to have gone through your checklist.

6. Is This Trigger Signal Large & Commanding?
For a reversal to be a high probability A+ trade setup, it needs to be a large, obvious, and a commanding trigger signal. For example, a really obvious pin bar reversal that sticks out and away from all other price or a large engulfing bar. The best trigger signals stick out like a sore thumb, and as soon as you flick to the chart, they just stand out straight away. You should not have to search for them. If you are searching your chart and really trying to find a trigger signal, you really need to question this checkbox.

7. Is There Space to Trade Into, and is the Pre-trade Plan Written Out? 
This is crucial to the success of your trade setup. There have been many, many trades where I have ticked all six previous boxes, and yet because this seventh box cannot be ticked, the trade was not made. If there is no room to trade into; in other words, if there is a support or resistance in the way or lots of them close by that price is trading into, you need to look at the whole price action story, and if you can tick this box to make the trade. Part of this check-box is after working out the support and resistance levels and targets, writing out your pre-trade plan. Your pre-trade plan needs to include exactly how you are going to manage your trade, including your targets, your break-even spot, where your stop is going to go, and if you intend on having any trailing stops at all. Basically, how you are going to manage this trade needs to be put into a mini plan and written out, so all you then need to do is follow the plan. Plan your trade and trade your plan.

EXPLANATION HOMEWORK There are the seven check-box's fully detailed, outlined and explained in-depth for you with how you can use them in your trading and exactly how I use them in my own trading.

You can now download just the checklist by itself here as a clickable PDF checklist: YOUR HOMEWORK TO DO RIGHT NOW You now need to take this example and make a trade checklist of your own. Using your own trading style, your own trading plan and your own trading rules, you need to come up with an actionable checklist that is simple, easy to follow and that will make sure that before every single trade, you are staying within your trading edge and remaining consistent. The best software and free app that I literally use everyday of the year that will also be perfect for you to create your checklist is www.TickTick.com. www.TickTick.com allows you to create checklists and all sorts of other lists and reminders that automatically sync between your PC, phones and other applications. The great thing about this is that you can then print it out and stick it up beside your computer which you need to do so that going through your checklist one by one becomes a habit and ritual. You can also have this checklist on your phone where you literally check each rule off one by one. If you have any questions about this or anything, please just send me an email as I would love to hear from you! All the success, Johnathon http://tinyurl.com/qgacvgq CHECKLIST Is Price at a Major Support or Resistance Level? Is There a Compelling Price Action Story to Make the Trade? Is Price at a Swing High or Swing Low? Is Price in the High Volume Session for this Market or Pair? Is This Trigger Signal Buying Low & Selling High or Vice Versa? Is This Trigger Signal Large & Commanding? Is There Space to Trade Into, and Have You Written Out Your Pre-Trade Plan? 7 Rules to a High Probability A+ Trade Setup - Checklist PDF Copyright © 2015 - www.ForexSchoolOnline.com - All Rights Reserved.


Sunday, October 11, 2015

How to get 4 additional winning trades per month

After working on Wall Street as a trader for 23 years, and managing private client accounts for the past 13 years,  I’ve seen a number of miracles happen over time.
One of my biggest win’s early in my trading career, was a trade back in 1982.
So starting with just a paltry $8,000 to my name, I began buying silver on the futures exchanges.  As it turns out my analysis was spot on, and I ended up running my $8,000 account to a little over $280,000 in only 30 days.

Since that time I have modified my trading strategy  – slightly.
After 120,000 trades, 1,200 trading accounts, and 8 Wall Street Firms – I am going to give you an exact guide to walking away with 4 additional winning trades per month.
Before you read this article you have to agree with the following statements:
  • You won’t find a ‘magic pill’ in the markets – the markets will eat you alive if you do.
  • The Forex systems churned out by marketers on the internet are just laughable – especially if you think that’s how they make money on Wall Street.
  • Forget about making 20%+ per month – that’s how poor people think.
Now, if you agree with all three of those statements then I salute you.
You are part of a small group of people who can separate reality from outright dreams and lies. And for that reason you will understand the words in this article better than anyone.
I don’t have time for ‘internet traders’, the ‘Forex forums’, or any other breeding ground for newbies who pretend they really know how the markets work – and neither should you.
This article is going to be simple.
I am going to show you how to get 4 – yes, just 4 – additional winning trades every month.
Don’t be fooled by the goofy EA developers and internet marketers out there.
Having 4 profitable trades per month is more than enough to push you into the big boys club.

Why most people reading this article will NEVER make a single dollar

Most people reading this article won’t make a dime. Not because the content sucks – it is some of the best trading tips in the world (according to me).
It is because people are lazy and don’t implement what they learn.
It is because people lose their shit and take too much risk.
And it is because you might not be able to handle my style. My past results really are no indication of you making any money whatsoever.
You might simply not have what it takes. However, there are a small percentage of people who do. And by following the rules you might be one of them.
There are no guarantees. So read carefully and make sure you examine every word on this page as if your life depends on it. Because it might just change it forever – if you have what it takes.

#1. The last (& only) opportunity for profits in the Forex market

There is this big lie out there that hundreds of thousands of Forex traders believe.
And you may have believed this too at one point.
“The Forex market is the most liquid market in the world and therefore it cannot be manipulated“.
That is plain wrong.
Governments have been cracking down on big banks because of their manipulation of a whole host of markets.
Check out this article on the BBC:
Screenshot 2015-08-18 21.01.02
Have a look at this chart they supplied:
_78920580_forex_rigging_explainer1_624
Have you ever been knocked out of a trade that just seemed totally random?
Well, chances are somebody rigged it. And chances are… you didn’t confirm your trade with a “2-pattern overlay”. More on that in a little bit.
You and I are small fish who are competing with much MUCH bigger sharks. Sharks who know the waters better than you do.
I used to swim with them. Merrill Lynch was only one of 8 companies I worked for on Wall Street. They did NOT take prisoners.
There are entire teams who’s job it is to cheat the system. And those are some of the brightest minds in the world from the best universities in the world.
You have to accept that you cannot beat them.

That’s why, what I’m about to reveal, is the very last opportunity to profit in the Forex markets.

Forget scraping a few pips off the charts.
Forget taking daily pivot trades, or “snipers”, or FAPTurbos, or whatever else these idiots are selling these days.
You have to stick to simple daily trades that unfold over a period of days, weeks, and sometimes months.
By riding the wave on a boat, you’ll be safe from the sharks on Wall Street.
If you want to get all of my trades for the next 14 days then click here and I’ll email them to you.

#2. How to dominate a currency with profitable trades

That’s a lie. You can never ‘dominate’ a market. That kind of thinking will get your account murdered.
However, you can put the odds severely in your favor by doing one thing.

You can use a simple “2-pattern overlay” before entering a trade

I’ve been using this since the 80s and it still works better than anything.
One million dollar client at EF Hutton & Co (another Wall Street company) dubbed me the “2-pattern wizard”.
Every time I used it he knew he was about to make enough cash to buy another house.
All you do is look for a minimum of two chart patterns to “confirm the trade”.
Now, that doesn’t mean you confirm an entry. You simply confirm that you potentially want to take a trade.
Here’s an example from one of my trades:
Example 2 pattern overlay
I saw a triple “core support bounce”, and then a simple overhead resistance. (If you don’t know how to spot price patterns then don’t worry… I’ll get to that).
DON’T jump into the trade just yet – it isn’t that easy.
You still have to know when to enter. I use a very specific ‘trigger’ that usually means the market is coiled like a spring, ready to burst in the right direction.
Keep reading and you’ll learn all about it.

#3. Use this simple trigger

Most newbies would simply jump into the trade because they saw a “double bottom” or some other pattern.
You and I know better.
You have to wait for the market to form a coil.
There are several different types of market “coils”, however the one I’m about to reveal is the easiest to spot and tends to give me better results.
It is called an “inside day bar”.
So, looking at the daily chart I would wait for this bar to form.
inside-day-bar
Here’s a real live example from a trade I took a while ago:
Screenshot 2015-08-20 17.31.49
Two inside day bars were the beginning of a nice coil. Here’s another example:
Screenshot 2015-08-20 17.34.30

#4. Have a tight stop loss and await the coming burst in movement

Remember that silver trade I told you about in the 1980s? It was my first big win.
Even though I turned $8k into $280k the risk was minimal. I did that by scaling into a rocketing market. Despite what people say… NEVER do that.
Not until you understand the true risks involved.
It can take a heavy psychological impact on you. I once saw a guy at Commodities Corp (now a division of Goldman Sachs) throw his computer across the room because he leveraged his position by scaling in too much.
Theres no need to do it.
Simply stick with what I am about to reveal and you could walk away with a handful of winning trades each month.

Keep the initial stop loss tight, and then keep it loose…

The initial stop loss is very tight. I anchor it close to the previous bar.
If you’ve established the correct price action and trigger bar, you should see it shoot off in the right direction.
Only 1 out of 2 trades tends to linger around. If they turn, then it means the trade is a dud and your stop loss will kick you out quickly.
However, when it goes… it goes.
Here’s an example of a good trade I took.
graph51
I made a fat 5.2% in about one week.
This example shows how it immediately jumped in my favor. That means I spotted a good coil.
By the way… those are actual trades. My trading platform marks them with those little circled arrows.
Here’s another example:
EURGBP immediately jumped after a trigger coil for a 2.5% gain in just one day.
graph11
I don’t usually exit trades in the same day, however, 2.5% is a lot of money in my world.
You don’t often see 2.5% days. If everyday was like that my account would grow by a billion every month.
So when it happens… I take it.

#5. Exiting the trade for a fat profit

This is how you get 4 additional winning trades.
If you get the coil right. Your trade should shoot out of the block like Usain Bolt.
This allows you to have a tight stop loss. It puts you in a great position to make huge gains with a tiny risk.
If your stop loss was far away from your initial entry then your risk would be greater and you’ll have to reduce your position size.
Therefore, I would recommend a hard and fast 3:1 risk reward ratio.
If your stop loss is 35 pips away, your profit target will be 105 pips (three times the stop loss).
Now, admittedly I use a way more complicated process for my exits. I could write an entire book on it.
However, when I looked back at my last 300 trades, I noticed that if I used THIS exit strategy I would still have made a great return.
It is simple and it takes psychology out of the equation.

#6. How to ‘never’ lose

I learned this while working at Bridgewater Associates (they manage about $170 billion) from a funny looking Irishman.
Back in 2011/2012 I forgot this rule and I duly got slaughtered.
There is a story inside of the book ‘Marketing Wizzards’. It talks about a great trader who locks himself in a room with no distractions. No windows. No TV. No Computer.
He has his assistant bring him his chart-book without the instruments named.
So he doesn’t know if he’s trading pork bellies or gold. He doesn’t care.
All he cares about is the price and the fact that he has no distractions. It means he ‘never loses’.
My rule gives me the same sort of piece of mind.

Before I let you in on it you must know what I mean by ‘never’ lose.

When you lose a trade – you aren’t ‘losing’. It is simply part of the process. It is the equivalent of a business expense.
You will always lose trades. However, when you lose your mind and you don’t follow your own rules. That’s when you truly lose.
So here are the exact rules you need to follow to NEVER lose, always stick to your rules, and always win in the long run.
Do not share your trading results
I did once. And only once.
It was a huge mistake.
All of the sudden I was answerable to thousands of people who happen to stumble across my profile. This doesn’t work when you are a trader.
I lost focus. I kept fussing about whether a trade was a winner or a loser. I didn’t focus on whether it followed the rules or not.
As long as you follow the rules… you are winning.
When you don’t follow the rules – you are losing (even when you make a profit).
Systems and routines are the only thing that make you profitable in the long run.
It is the only thing that’ll protect you against the sharks.
So whatever you do – don’t share you trading results. Not even with your husband or wife.
It’ll put external pressures on you.
Don’t even mention a winning trade or a losing trade. Simply tell them you’re winning because you followed the rules.

#7. How to make $1m from trading

Do you want to know the real secret?
The one that most people ignore, because they don’t really take their trading seriously?
Well, it is a system of recording and documenting your trades in detail.
I call it a trade journal. Super original right?
Every single time I am about to take a trade, I stop.
I take a snapshot of the chart, I write out my analysis (the reason WHY), and then I enter the order.
90% of my orders are pending orders, which means they only enter when the market reaches a specific price.

This is an example of three pages inside of my journal.
Trade Journal
By doing this with your trading you’ll be able to get a lot more focussed.
When you look at the markets you will feel excited. You will get a rush of adrenaline.
Stop. Take a deep breath and start recording the trade before it happens.
It gives you the breathing room you need to make rational decisions. It helps you to be a winner every time by following the rules.
I have taken over 120,000 trades in my life. And the only times when I was consistently profitable was when I kept a journal.
If you want to receive my journal for the next 14 days then click here and I’ll send it to you.
Seriously. Get my journal. It’ll show you how you should structure yours for maximum results.
You’ll also get a better feel for the way I trade.

Now you have two choices

I should congratulate you. You’ve read the entire article.
However, this is just the start. You now face two choices.
Choice #1
Forget what I told you and keep doing what everybody else is doing.
It is easier to follow the herd after all. Some of the things I talked about aren’t easy. Some of them are plain boring.
Yet this is what it takes. And I think you know that, which is why you’ll probably go for…
Choice #2
This is the choice smart Forex traders go for.
You grit your teeth and follow the rules.
So that you can finally break away from the ‘internet heard’ and actually start taking pride in being a trader.

Be the person that “actually makes money”. How nice would that feel for a change?

Compound Interest is The Holy Grail of making money?

Compound interest is a mathematical principle that creates those staggering growth curves we have all seen. Understanding compound interest is of great importance as a trader because it teaches you many lessons that are critical to internalize if you want to stay on top of your game.
Compound interest 101
Compound interest works so well because you let your money work for you. The graphic below illustrates the power of compound interest. The starting point is a trading account with $10,000 and a trading system with a winrate of 55%, an average position size of 2% and the average Reward:Risk ratio (or R-multiple) is 2. If you multiply these figures out, you get a trading system with a trade expectancy of 1.3% – this means that every trade has an expected outcome of 1.3% over the long-term.
Recap – expectancy calculation:
General Formula: (Winrate * Position Size * Reward:Risk ) – [ (1 – Winrate) * Position Size] = Trade Expectancy
So with a trading account of $10,000 the first trade has an expected outcome of +$130. After some more trades, your account has grown to $15,000 – at this point, the 1.3% are +$195 per trade. Although the change from $130 per trade to $195 per trade doesn’t seem big, but keep in mind, you don’t have to do much different; you are still trading the same system with the same metrics. 
compound
After some more trades, your account is now at $20,000 and the 1.3% are now worth $260. This is still the “slow growth” period for your trading account and the toughest period for any trader.
After making it through the slow growth period, things start to get interesting. After 200 trades, the 1.3% will be worth almost $1700 per trade – following the same trading routine. This is when exponential growth really starts to kick in. After 500 trades, the 1.3% are worth an incredible $81,000 per trade.
Word of caution: Although exponential growth is not a theory but a mathematical principle that is irrefutable, you have to be aware of some trading specific issues. As your trading account growths, you will experience some “size-related issues”, meaning that getting a fill might become harder and entering a trade with one large position will become increasingly difficult. 
The lessons of compound interest

Patience

Developing patience is the most important factor when it comes to using the principle of compound interest. Most amateur traders make some calculations and then get too excited about where they could be in 100, 200 or 500 trades. But back in reality they get frustrated because their $2,000 account is not producing the returns they are after.
90% of your trading journey will be slow and “boring” because compound interest only really kicks in once your trading account reaches a certain size. Thus, most traders will never get there because they give up too early and change trading systems, hoping to find something that will generate greater returns faster. Can you accept to make little money for the next few years in exchange for a potentially high reward at some point far in the future?
The graphic below shows a simulation of a trading account with relatively conservative metrics (winrate 50% and an average Reward:Risk ratio of 1.5). Most traders will only look at the right and only see how much the account grew. But they don’t understand that it took years of low returns to get there (this simulator is available in the Edgewonk trading journal).
compound2
Consistency
Once you have understood that you need to be patient, it comes down to applying consistency to your performance. Everything significant that has ever been achieved is based on the principle of consistency. The tallest building in the world started with one brick and by consistently laying brick upon brick. Arnold Schwarzenegger became the best body builder of all times because he consistently worked out every single day, building his body little by little. The Fortune500 companies got to the top by making customers happy – one at a time – and by continuously making small improvements.
As a trader, you have to bring your best game every single day. And even if it looks as if your trading account will never amount to anything meaningful, keep in mind that the principle of compound interest is irrefutable and it works every single time without exception – it’s a law of nature.

http://www.tradeciety.com/compound-interest-trading-holy-grail/