Thursday, December 26, 2013
Thursday, December 5, 2013
Free Candle Pattern Signal - PipHut.com
http://piphut.com/candlepro-performance/
You can select the time frame from 15m, 30m, H1, H4 and Daily based on last 10 candles. It will select the best 5 pattern from different currency pairs.
===========================================================

You can select the time frame from 15m, 30m, H1, H4 and Daily based on last 10 candles. It will select the best 5 pattern from different currency pairs.
Top 5 CandlePRO Signals from 2013-12-05
Welcome to the CandlePRO top performers scoreboard (beta)! Here you can find the top 5 signals for each timeframe for the previous period. Keep in mind that the results for each candle are tabulated over the 10 candles following the signal - this means that for 1h signals it takes 10 hours (or 10 candles), for 4h candles it takes 40 hours (or 10 candles), and for daily candlesticks it takes 10 days (10 candles!).
===========================================================
Friday, November 29, 2013
Free VPS Hosting for EA
Expert Advisors (EA) are automated trading strategies tailored to your specifications providing you with a high degree of flexibility, oversight and control. With them you can:
Analyse the market tick-by-tick for trading opportunities
Trigger trades and orders automatically, based on your parameters
Set money management limits to suit your trading style
Create custom indicators or modify existing ones
Expert Advisor Hosting is ideal for clients who wish to run their EAs 24/6 during trading hours, without managing them on their own computers. With EA Hosting, you'll benefit from having your EAs run in a professional environment designed for maximum uptime.
Expert Advisor Hosting features include:
Run EAs on a dedicated Unix server, for maximum uptime
Pre-installed MetaTrader 4 software on the VPS solution
Access your account from any OS with a web browser
Easily upload and manage your EAs with a fast and secure account manager
My recommendation would be just pay a small fee US18 /mth instead of trying to commit the minimum volume to save the fee. I have been using SWVPS for over 5 years and satisfy with its performance and value for money. It can run up to 3 instances or 3 accounts without problem via the minimum package US18/mth and if pay by yearly at US180 with 2 months free.
http://www.swvps.com/web/idevaffiliate.php?id=132

======================================================================
Free VPS offered by MT4 Brokers
Forex.com / UK minimum deposit US5,000.
In order to qualify for complimentary access to Expert Advisor Hosting you must have a minimum of $5,000 in your account.
Continued eligibility is based on the trading activity and total assets in your account. For continued access to Expert Advisor Hosting, you must execute at least 10 round trip mini lots or the equivalent per calendar month and maintain a minimum of $5,000 in your account.
They will re-evaluate your eligibility at the end of each calendar month. Accounts that do not meet the minimum requirement will be denied access to Expert Advisor Hosting. Expert Advisor Hosting is provided by Gallant Partners Hosting.
http://www.forex.com/uk/trading-platforms/metatrader/ea-hosting.html
=========================================================
GFT minimum US2,500 deposit and minimum 5.0 lot / mth or US35/mth.
Boston Technologies VPS
==========================================================
YTFX minimum US10,000 deposit.
==========================================================
http://www.ibfx.com/AutoTrading/Red-Paladin
IBFX - Red-Paladin minimum US5,000 deposit.
The monthly cost of Red Paladin Nexus VDI for IBFX users is $29.99 (512MB), $34.99 (1GB), $44.99 (2GB), or $74.99 (4GB) depending on the package you select. IBFX customers may use Promocodesibfx4x10 or ibfx4x15 to receive the discount. Additional discounts can be applied when you prepay quarterly, bi-annually, or annually. No Contract is required.
Analyse the market tick-by-tick for trading opportunities
Trigger trades and orders automatically, based on your parameters
Set money management limits to suit your trading style
Create custom indicators or modify existing ones
Expert Advisor Hosting is ideal for clients who wish to run their EAs 24/6 during trading hours, without managing them on their own computers. With EA Hosting, you'll benefit from having your EAs run in a professional environment designed for maximum uptime.
Expert Advisor Hosting features include:
Run EAs on a dedicated Unix server, for maximum uptime
Pre-installed MetaTrader 4 software on the VPS solution
Access your account from any OS with a web browser
Easily upload and manage your EAs with a fast and secure account manager
My recommendation would be just pay a small fee US18 /mth instead of trying to commit the minimum volume to save the fee. I have been using SWVPS for over 5 years and satisfy with its performance and value for money. It can run up to 3 instances or 3 accounts without problem via the minimum package US18/mth and if pay by yearly at US180 with 2 months free.
http://www.swvps.com/web/idevaffiliate.php?id=132
======================================================================
Free VPS offered by MT4 Brokers
Forex.com / UK minimum deposit US5,000.
In order to qualify for complimentary access to Expert Advisor Hosting you must have a minimum of $5,000 in your account.
Continued eligibility is based on the trading activity and total assets in your account. For continued access to Expert Advisor Hosting, you must execute at least 10 round trip mini lots or the equivalent per calendar month and maintain a minimum of $5,000 in your account.
They will re-evaluate your eligibility at the end of each calendar month. Accounts that do not meet the minimum requirement will be denied access to Expert Advisor Hosting. Expert Advisor Hosting is provided by Gallant Partners Hosting.
http://www.forex.com/uk/trading-platforms/metatrader/ea-hosting.html
=========================================================
GFT minimum US2,500 deposit and minimum 5.0 lot / mth or US35/mth.
Boston Technologies VPS
==========================================================
YTFX minimum US10,000 deposit.
==========================================================
http://www.ibfx.com/AutoTrading/Red-Paladin
IBFX - Red-Paladin minimum US5,000 deposit.
The monthly cost of Red Paladin Nexus VDI for IBFX users is $29.99 (512MB), $34.99 (1GB), $44.99 (2GB), or $74.99 (4GB) depending on the package you select. IBFX customers may use Promocodesibfx4x10 or ibfx4x15 to receive the discount. Additional discounts can be applied when you prepay quarterly, bi-annually, or annually. No Contract is required.
Thursday, November 21, 2013
Can you use your CPF to repay housing after 55?
Can you use your CPF to repay housing loans after 55?
Whether your CPF can be used to repay housing loans after 55, depends on how much CPF savings you have at 55, and how much you have already used for housing.
The CPF Investment Scheme (CPFIS) has a minimum sum reserve first S$20,000 for Ordinary Account (OA) and first $40,000 for Special Account (SA).
When you turn 55, a Retirement Account (RA) is created using savings from first your Special Account, then Ordinary Account (OA) to meet the Minimum Sum (MS - $148,000 currently) relevant to your cohort. While the MS provides monthly payouts from your draw down age, the balance in your OA can be used for housing loan repayments.
Members who are able to set aside more than half of the MS, will be able to use the amount in excess of half of the MS for housing loan repayments.
For example:
If you continue working after 55, your CPF OA contributions can also be used for housing loan repayments.
However, housing withdrawal limits may apply. This is to safeguard members from overspending on their housing loan repayments at the expense of their retirement savings.
============================================================================
Distributing your CPF according to your wishes
Did you know?
Whether your CPF can be used to repay housing loans after 55, depends on how much CPF savings you have at 55, and how much you have already used for housing.
The CPF Investment Scheme (CPFIS) has a minimum sum reserve first S$20,000 for Ordinary Account (OA) and first $40,000 for Special Account (SA).
When you turn 55, a Retirement Account (RA) is created using savings from first your Special Account, then Ordinary Account (OA) to meet the Minimum Sum (MS - $148,000 currently) relevant to your cohort. While the MS provides monthly payouts from your draw down age, the balance in your OA can be used for housing loan repayments.
Members who are able to set aside more than half of the MS, will be able to use the amount in excess of half of the MS for housing loan repayments.
For example:
 |
If you continue working after 55, your CPF OA contributions can also be used for housing loan repayments.
However, housing withdrawal limits may apply. This is to safeguard members from overspending on their housing loan repayments at the expense of their retirement savings.
============================================================================
Distributing your CPF according to your wishes
Did you know?
- Your Medisave Account savings are covered under CPF Nomination, in addition to those in your Ordinary, Special and Retirement Accounts.
- If you do not make a CPF Nomination, your CPF savings will be distributed to your loved ones according to the applicable intestacy and inheritance laws.
- When you get married, any CPF Nomination made before marriage will be revoked.
- You need two witnesses to make a CPF Nomination. Our customer service executives at our Service Centres can be your witnesses.
| Find out how you can distribute your CPF savings according to your wishes with our 5-minute webcast. |
Tuesday, November 19, 2013
Probability Lab - Interactive Broker
https://www.interactivebrokers.com/en/index.php?f=5910
Practical way to think about options without complicated mathematics.
Practical way to think about options without complicated mathematics.
- Probability distribution (PD)
- The nature of stock prices
- You can calculate the PD from option prices and vice versa
- PD implied by the market and your opinion
- The best trades and potential consequences
Total Number of Accounts as per NFA report on Q3 2013
Interactive Brokers - 23,759
FXCM - 22,855
Oanda - 20,813
Gain Capital - 11,855
IBFX - 8,718
FXDD - 5,118
Interactive Brokers - 23,759
FXCM - 22,855
Oanda - 20,813
Gain Capital - 11,855
IBFX - 8,718
FXDD - 5,118
| Percentage of profitable and unprofitable accounts as reported to the NFA - Q3 2013 |
| % Profit | % Loss | Total Accounts | Spread Markups | |
| Interactive Brokers | 44.0% | 56.0% | 23,759 | NO |
| OANDA | 35.1% | 64.9% | 20,812 | YES |
| FXDD | 29.1% | 70.9% | 5,118 | YES |
| ILQ | 22.3% | 77.7% | 1,138 | YES |
| Gain Capital | 31.0% | 69.0% | 11,425 | YES |
| IBFX/TradeStation | 32.0% | 68.0% | 8,718 | YES |
| FXCM | 28.0% | 72.0% | 22,055 | YES |
| MB Trading | 27.2% | 72.8% | 3,365 | YES |
Monday, November 18, 2013
London Breakout Strategy
There are many variation. Below is abstracted from http://fxtradingport.blogspot.sg by an experienced forex trader and backtested on EURUSD.
Based on last 4 hourly candle prior to London opening and SMA-50.
 This strategy is adopted from a forum in a prominent forex broker. The author of the strategy provides eight-month back testing result. I have done a research on this strategy, and it looks like a simple yet great strategy to be used for intraday trading. The following is what the author elaborates on the strategy.
With London being the most important trading center, and the one that, more often than not, sets up the trend for the rest of the day, I started looking for possible trading patterns that could give us an edge. After four failed attempts (all based on the idea of breakouts, because that's what I had in mind from the start, due to their simplicity), I finally developed a simple strategy that was showing promising results in the preliminary tests.
Preparing your charts:
Entry Rules:
 Initial stop-loss (SL):
 Trailing stop-loss:

 Money management and position sizing
Although you don't need to use my money management rules, you can simply trade a fixed lot size if you prefer, regardless of how wide/tight the SL is, that is something I do not recommend doing. I created a simple Excel calculator that indicates the amount to trade, based on the percentage of capital the trader wants to risk per trade, as well as the difference between the opening price and initial stop-loss. The wider the stop-loss is the smaller the position will be. This is how it looks like:

It is assumed that the trader will trade bigger when the account gets bigger (change the "account balance" in the calculator), and vice-versa in periods of losses. This way you will compound the profits and achieve a higher rate of return than if you traded the same amount all the time.
Backtesting results
Due to my almost complete inability to program anything, I did a manual (and very time-consuming) backtest of this strategy on EUR/USD for 8 months, from July 2, 2012, to February 28, 2013. 1.2 pips were taken from each position, for spread and commissions, and the risk per trade was 3% of the account balance.
This was not a very long backtest, but in this period we had range-bound markets, strong trends, low volatility, extreme volatility, basically all kinds of market states. So these 141 trades can give us a good idea of the profitability of the system.
Risking only 3% per trade the system produced a return of 60.68% in 8 months, which is equivalent to a compound annual growth rate (CAGR) of 103.67%, while the maximum drawdown was only 12.62%. All in all the results are even better than I anticipated. If you are willing to accept drawdowns of around 25%, then you could risk 6% per trade, and achieve a return of almost 210% in a year. Past performance is no guarantee of future results, but I'm confident that this strategy can keep performing well in the long run. The profit factor is nothing extraordinary, but that is typical of short term strategies.

 Final thoughts
Basically, this strategy allows us to catch the intraday trend, after the price breaches the levels reached during the late Asian session, and sticking with it until it reverses or consolidates for a long period, and does a very good job at it, even though it is very simple. If you employ basic trading tactics, such as going with trend, cutting your losses short and riding your winners, simple strategies can give us very good returns.
One final note to say that you have to take into consideration the Daylight Saving Time (when the hour changes) that happen twice a year. Make sure you always look for the previous 4 candles once the London session opens, it may not be at 8 GMT all year.
DISCLAIMER
This strategy is presented for forex educational purposes only. I hold no responsibility for any loss that might occur from the strategy. Test the strategy in a demo account before using it in a real account.
(fxtp)
FOREX STRATEGY #12: LONDON SESSION PROFITABLE TRADING

With London being the most important trading center, and the one that, more often than not, sets up the trend for the rest of the day, I started looking for possible trading patterns that could give us an edge. After four failed attempts (all based on the idea of breakouts, because that's what I had in mind from the start, due to their simplicity), I finally developed a simple strategy that was showing promising results in the preliminary tests.
Preparing your charts:
- Trade only the major currency pairs (EUR/USD, USD/JPY, EUR/JPY, etc), due to their lower spreads and less frequent price spikes.
- Hourly candlestick chart.
- Add a 50-period simple moving average (50 SMA), this will be our trend filter.
Entry Rules:
- At 8:00 GMT, when the London session opens, check the highest high and the lowest low of the previous 4 candles, which are the 4, 5, 6 and 7 GMT candles.
- Go long if the price breaches the highest high of those 4 candles and is above the 50 SMA.
- Go short if the price breaches the lowest low of the 4, 5, 6 and 7 GMT candles and is below the 50 SMA.
- Maximum of one trade open per day (either long or short, whichever happens first).
- Trades are only opened if a signal is given until the end of the London session (17:00 GMT). So the last hourly candle where we can open a new position is the 16:00 one.
- You can place your conditional orders at 8:00 GMT, this way you don't have to constantly monitor the chart nor open the position manually.
- If you open a long position, then the SL is always placed at the lowest low of the 4 to 7 GMT candles.
- If you open a short position, the SL is placed at the highest high of those 4 candles.
- No take profit orders are used.
- The initial SL is valid for the candle when the trade was filled, in subsequent bars the stop is manually moved to the lowest low or highest high of the preceding 3 candles, and updated hourly as the trade moves in our favor.
- Example: If the current candle is the 13:00 GMT one and you are long since the 12:00 GMT bar, the stop-loss will be placed at the lowest low of the 10, 11 and 12 GMT candles
- The trailing stop can never be lower/higher than the initial SL, it can only move in our favor.
- The trade is closed manually at the end of the trading day (22:00 GMT) if the stop-loss has not been hit by then.
- No take profit orders are used.
Although you don't need to use my money management rules, you can simply trade a fixed lot size if you prefer, regardless of how wide/tight the SL is, that is something I do not recommend doing. I created a simple Excel calculator that indicates the amount to trade, based on the percentage of capital the trader wants to risk per trade, as well as the difference between the opening price and initial stop-loss. The wider the stop-loss is the smaller the position will be. This is how it looks like:
It is assumed that the trader will trade bigger when the account gets bigger (change the "account balance" in the calculator), and vice-versa in periods of losses. This way you will compound the profits and achieve a higher rate of return than if you traded the same amount all the time.
Backtesting results
Due to my almost complete inability to program anything, I did a manual (and very time-consuming) backtest of this strategy on EUR/USD for 8 months, from July 2, 2012, to February 28, 2013. 1.2 pips were taken from each position, for spread and commissions, and the risk per trade was 3% of the account balance.
This was not a very long backtest, but in this period we had range-bound markets, strong trends, low volatility, extreme volatility, basically all kinds of market states. So these 141 trades can give us a good idea of the profitability of the system.
Due to my almost complete inability to program anything, I did a manual (and very time-consuming) backtest of this strategy on EUR/USD for 8 months, from July 2, 2012, to February 28, 2013. 1.2 pips were taken from each position, for spread and commissions, and the risk per trade was 3% of the account balance.
This was not a very long backtest, but in this period we had range-bound markets, strong trends, low volatility, extreme volatility, basically all kinds of market states. So these 141 trades can give us a good idea of the profitability of the system.
Risking only 3% per trade the system produced a return of 60.68% in 8 months, which is equivalent to a compound annual growth rate (CAGR) of 103.67%, while the maximum drawdown was only 12.62%. All in all the results are even better than I anticipated. If you are willing to accept drawdowns of around 25%, then you could risk 6% per trade, and achieve a return of almost 210% in a year. Past performance is no guarantee of future results, but I'm confident that this strategy can keep performing well in the long run. The profit factor is nothing extraordinary, but that is typical of short term strategies.
Basically, this strategy allows us to catch the intraday trend, after the price breaches the levels reached during the late Asian session, and sticking with it until it reverses or consolidates for a long period, and does a very good job at it, even though it is very simple. If you employ basic trading tactics, such as going with trend, cutting your losses short and riding your winners, simple strategies can give us very good returns.
One final note to say that you have to take into consideration the Daylight Saving Time (when the hour changes) that happen twice a year. Make sure you always look for the previous 4 candles once the London session opens, it may not be at 8 GMT all year.
DISCLAIMER
This strategy is presented for forex educational purposes only. I hold no responsibility for any loss that might occur from the strategy. Test the strategy in a demo account before using it in a real account.
(fxtp)
Should you Follow Zulutraders?
Zulutrade is a group of signal providers website. This is similliar to PAMM service.
http://www.zulutrade.com/performance
The idea is to follow experienced traders and earn money with them. However if you rely on zulutrade to earn you money most likely you will only lose more eventually.
The systems that are considered the best in Zulutrade are simply high Risk:reward systems that do well until that one day when they go bust. Most of the signal providers have quite a few different accounts and that is because most of their accounts may fail before they can get any live followers.
Zulutrade has a complicated way of ranking systems or signal providers and they do NOT rank the good systems or high profit system at the top. If you have actually looked at the systems you will have noticed that most of them average 7-11 pips per trade and taking way too many trades and high draw down.
The reason these systems are at the top is because they make commissions off the trades, the more trades taken the more profit they make so obviously they will want to rank those systems at the top. The traders on zulutrade get paid half of one pip per trade. However, most successful traders do not take that many trades and only average 7-10 pips profit per trade.
Sunday, November 17, 2013
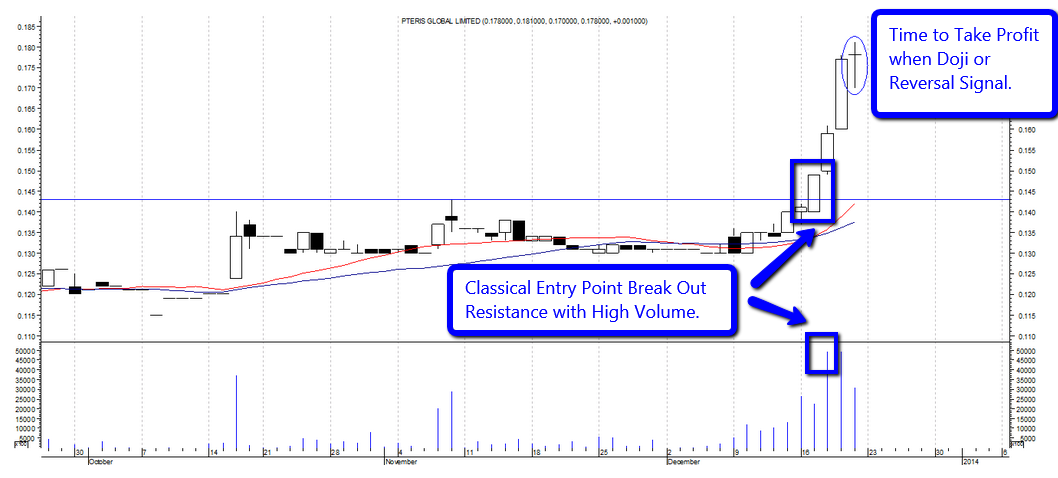
How to spot a market crash?
Look for reversal Pin Bar or 2-Bar setup on top with high volume.

==================================================================
Dow Jones have been strongly uptrend till now, so how do we spot an early signal of profit taking and market u-turn or crash?
There are few tell tale sign to look for.
1. Dow has more than -100 point decrease over night.
2. Dow has continuously down for 3 consecutive days.
The above two are warning sign for short term correction.
3. Dow has continue down for 3 weeks.
This will warn for a mid term correction.
** By Daniel Loh
==================================================================

==================================================================
Dow Jones have been strongly uptrend till now, so how do we spot an early signal of profit taking and market u-turn or crash?
There are few tell tale sign to look for.
1. Dow has more than -100 point decrease over night.
2. Dow has continuously down for 3 consecutive days.
The above two are warning sign for short term correction.
3. Dow has continue down for 3 weeks.
This will warn for a mid term correction.
** By Daniel Loh
==================================================================
Wednesday, November 13, 2013
Earn cash back rebate on trading > USD$2,000

Open Cash Back Account
Note: This is not a scam as I was sceptical like you in the beginning. But as I have received cash back every month to my paypal account and nothing change on my brokers spread and platform, I am convince this is good to recommend for all. Attached my latest Oct13 cash rebate USD$2,097 screen shot.

Note: If you open the cash back account with my referral quote 14243 and email to me rtan999@gmail.com I can give you some guidance on how to achieve big cash back rebate every month and which broker to choose to get biggest rebate.
Get Cash Back When You Trade At Industry Leading Brokers
First time visitors to our website are often either skeptical or already aware of the incredible benefits of our cash back service through exposure to the tens of thousands of traders currently using Cash Back Forex. When you open a trading account through us we earn a commission from your broker for each trade you place. From this commission we in turn pay you cash for each trade you place. Your spreads and trading conditions DO NOT change, they remain the same as if you had opened an account directly with the broker. The only difference is that a client that opens their account through us gets extra cash for each trade. As the largest and most sought after broker marketing tool on the web and with volume far exceeding all other rebate providers combined.When And How Will I Receive My Payment?
Rebates are paid on a monthly basis no later than the 25th of the month following the month commissions were earned in. I received it monthly around third week of the month.Open CashBack Account
Compare Brokers

===================================================================
This month for Nov-2013 cashback I got another US 1455 rebate.

Tuesday, November 12, 2013
Trading Books
To improve trading skill, knowledge is essential. Trading books can be found in amazon.com
http://www.amazon.com/Naked-Forex-High-Probability-Techniques-Indicators/dp/1118114019/ref=sr_1_1?ie=UTF8&qid=1383990471&sr=8-1&keywords=naked+forex
A streamlined and highly effective approach to trading without indicators
http://www.amazon.com/Naked-Forex-High-Probability-Techniques-Indicators/dp/1118114019/ref=sr_1_1?ie=UTF8&qid=1383990471&sr=8-1&keywords=naked+forex
Naked Forex: High-Probability Techniques for Trading Without Indicators (Wiley Trading) Hardcover
Most forex traders rely on technical analysis books written for stock, futures, and option traders. However, long before computers and calculators, traders were trading naked. Naked trading is the simplest (and oldest) trading method. It's simply trading without technical indicators, and that is exactly what this book is about.
Traders who use standard technical indicators focus on the indicators. Traders using naked trading techniques focus on the price chart. Naked trading is a simple and superior way to trade and is suited to those traders looking to quickly achieve expertise with a trading method.
- Offers a simpler way for traders to make effective decisions using the price chart
- Based on coauthor Walter Peters method of trading and managing money almost exclusively without indicators
- Coauthor Alexander Nekritin is the CEO and President of TradersChoiceFX, one of the largest Forex introducing brokers in the world
Naked Forex teaches traders how to profit the simple naked way!
Thursday, November 7, 2013
MT4 Broker for Korean Won
There are not many MT4 brokers has Korean Won (KRW) electronic trading platform.

After searching around, finally come across one....

The other broker is Interactive Broker but limited trading hours on KRW.
SGX just launch KRW-USD (KU) Futures from 11Nov13. It is monthly contract expired 2 business days prior to the 3rd Wednesday of every month. T session: 740am - 735pm. T+1 from 815pm - 2am. Tic value is USD 2.50.
http://sgx.com/wps/wcm/connect/sgx_en/home/higlights/news_releases/sgx+launches+asian+foreign+exchange+futures
http://sgx.com/wps/wcm/connect/sgx_en/home/higlights/news_releases/sgx+launches+asian+foreign+exchange+futures
Thursday, October 31, 2013
Forex MTF (Multi Time Frame) Scalping Strategy
Scalping is a strategy where a trader enters and exits quickly, roughly within five minutes. If the trading exits after 1 hour, it is not scalping but considered as regular trading.
A simple MTF scalping strategy widely known on the Internet, published by a well-known author:
1. Plain vanilla candlestick chart (no indicators at all)
2. Use only 4 time frames: 5 min. 15 min. 30 min, and 1 hour
3. You don't need to sit in front of your computer all the time. Just be there 5 minutes before the hour switched. For example, if you want to trade at 6.00, get yourself ready at 5.55. Then, if you find no signals, get another chance at 7.00 and again get ready at 6.55.
RULES TO BUY:
- All candles in four time frames have to close as green candles. Do not buy even if you have only one red candle (three green candles).
- When the above requirement is met, use your 1 hour chart, wait for price to move up 3 pips. When it has moved up 3 pips, immediately place long. Do not buy if the price doesn't go up 3 pips more after the closing.
RULES TO SELL:
- All candles in four time frames have to close as red candles. Do not buy even if you have only one green candle (three red candles).
- When the above requirement is met, use your 1 hour chart, wait for price to move down 3 pips. When it has moved down 3 pips, immediately place short. Do not sell if the price doesn't go down 3 pips more after the closing.
IPO Trading Strategy
To trade IPO with Technical Analysis is impossible as there is no references for past history.
One way is to use the Closing Price (CLP) on the IPO Day as a reference guide.
If the counter stays below the CLP then avoid this counter.
If the counter can stay above CLP then buy it. Stop Loss is the Day Low or Day High on the IPO Day.
This strategy can only be used for upto 6 months from its IPO day.
The best result is 1-3mths period from its IPO day.
Do back test yourself as different market may behalf differently. This observation is done on SGX IPO debut day.
Wednesday, October 16, 2013
FX Broker and Trading School Scam and Alert
J Instructor at J school:
http://tankinlian.blogspot.sg/2011/11/unethical-forex-magic-trick_13.html
Singapore-Scams-Awareness
https://www.facebook.com/pages/Singapore-Scams-Awareness/127914440641494
Singapore-Blacklisted-Organisations
https://www.facebook.com/pages/Singapore-Blacklisted-Organisations/240768606075221
http://tankinlian.blogspot.sg/2011/11/unethical-forex-magic-trick_13.html
Singapore-Scams-Awareness
https://www.facebook.com/pages/Singapore-Scams-Awareness/127914440641494
Singapore-Blacklisted-Organisations
https://www.facebook.com/pages/Singapore-Blacklisted-Organisations/240768606075221
Tuesday, October 15, 2013
Multiple Time Frame
http://www.terraseeds.com/blog/2013/02/how-to-chart-with-multiple-time-frame-analysis-when-i-trade-forex/


How to chart with multiple time frame analysis when I trade forex?
Understanding multiple time frame analysis is crucial to understanding trend in forex
When you ask a forex trader ‘what is the trend?’, many come back ‘trend in what time frame?’ You see: traders approach the market in ways ranging from quick-in quick-out speculative trading to buy-and-hold investment. So there is also a proliferation of charts with multiple time frames. The MT4 software that I use for has eight different time frames to choose from.
So what is the implication of using so many charts?
You could pull out charts each telling you a different story and seldom do they agree with each other.
A new trader who has not decided how he intends to approach the market will be dazzled by it. A different setup in each chart tells an equally compelling story. A good analogy is the three blind man trying to describe an elephant based on the part that each individual encounters. A trader could walk into a ‘labyrinth’ of multiple time frames and get stuck for a long time trying to determine what trend the market is in.
Multiple time frame analysis is therefore something that forex traders have to master. In this article, we will visit the following concepts to do with multiple time frame analysis and at the end, I hope to shed light for traders who have to grapple with it daily.
- What is multiple time frame analysis?
- What problems does multiple time frame pose?
- What are the essentials of a good strategy that takes into account multiple time frame?
What is Multiple Time Frame Analysis?
Let’s come back to the question ‘what is trend’? A trader has to be able to look through not one chart but a set of charts, cut through the noise and make trading decisions.
Chart A and B illustrates this point best. Let’s just imagine that we have two charts only, the 4-hour (Chart A) and the 5-minute (Chart B). The long bearish candle that is enclosed in a red box in Chart A shows a single 4-hour interval. Chart B shows the same 4-hour segment broken down into 48 pieces of 5 minute segments.

Chart A – 4-hour chart of the EURUSD

Chart B – 5-minute chart of EURUSD showing an expansion of information
Depending on exactly which moment you look at price, you could get a different picture. Multiple time frame analysis is about putting together the real picture from many different charts.
What problems does multiple time frame pose?
Now because you could get charts of different time settings, forex traders face a challenge with the slew of information to process.
This simple increase in choice of chart settings creates a whole list of problems that plague traders.
- Misfit – Some traders use the wrong chart. The chart chosen does not fit their strategy or trading objective. If we were to borrow an example from the military, it is like an army general reading the small map of a platoon leader.
- Changing game plan – Some traders embark on a lifelong quest to search for the perfect chart setting. They end up constantly changing their strategy and never achieving mastery.
- Indecision – Some traders think that the more the merrier. They attempt to use many charts and each gives them a different picture. They get confused and become immobilised.
- False signals – Here I would single out one group of traders who also face exceptional danger: the ‘indicator-trader’. This trader ignores price action and over relies on the use of indicators. In the multiple time frame environment, I have found that trading indicators add to noise instead of filtering it. They work only when there is a proper co-ordination with the trading objective and the best-fit trading time frame.
- ‘I cannot see what you see’ – Ultimately chart readers would like to be able to see what everyone else sees. We would like act together at the moment when everybody else decides to take action. This is how high probability outcomes happen. There is synergy. When there are so many timeframes to choose from, new traders are unable to tap into this synergy because they don’t how to which time frame or picture to connect.
What are the essentials of a good strategy that takes into multiple time frame?
Since mastering the picture in multiple time frames is complex, many professional traders develop their own strategies. Rather than single out any method for discussion here (which might end up tedious and maybe not suitable to you dear reader), I will list essential components for you.
- Choose a chart to be the road map. There is where buy or sell decisions are made.
- Choose another chart that is typically a lower time frame to fine-tune or execute the buy or sell order. As an example, the road map might be a chart with 1-hour and you have decided it to be true to the trend of the market; you use a 15-minute chart to determine how you enter and exit your 1-hour trend. Even if 15-minute chart shows an opposite picture, you decide that it is merely a correction of the 1-hour trend.
- Inspect the ‘higher’ charts such as the daily or 4-hour charts occasionally because this is the big picture that ‘big boys’ like fund managers, analysts are looking at.
- Do not use more than 3 charts. Beginners should start with one whereas most will use two. For forex trading, the 1-hour chart or 4-hour is a good place to start.
- Your chosen time frames should not be too far apart. For example, don’t combine a 4-hour and a 1-minute chart.
- Find the road map that best fits your trading objective, the duration you intend to hold a position and desired level of volatility.
- Charts of lower time frame don’t necessary give you an edge in speed. In fact they produce a lot of noise.
I have some tips here for practicing sound multiple time frame analysis:
- Scalpers who like to trade short durations with 10 – 20 pip targets can use 5-minute and 1-minute charts together.
- Day traders who can hold a position for a few hours or overnight can combine 1-hour and 15-minute charts.
- Any person who is busy and is happy to do 1-2 trades a week can trade 4-hour and 1 hour charts.
- Anyone who wants to buy and hold and even earn some positive swap should really be looking at daily charts and above.
- Unless you have the patience to form your own strategy with a demo account, a good coach can speed the learning curve for you.
- Strategies that use support and resistance are the best because they stay true regardless of time frame. Technical studies that excel in this respect are price-based analysis such as Fibonacci Levels, Pivot Points, trendlines and support resistance levels.
Here are some other postings on this topic:
Subscribe to:
Posts (Atom)