Friday, April 25, 2014

Invest for Income via Dividend Yield

Go for high dividend yield stock for passive income.

==========================================================

Send Friend Requests to https://www.facebook.com/meetup.fx


=========================================================

Dividend Stock Tracker


SGX i3Investor Dividend


SGX Corporate Action


==========================================================

Send Friend Requests to https://www.facebook.com/meetup.fx


=========================================================

Thursday, April 24, 2014

Myth and Fact about Risk Reward Ratio


==========================================================

Send Friend Requests to https://www.facebook.com/meetup.fx


=========================================================


One of the biggest myths in the trading world is that all traders can only be profitable with a minimum risk reward of 1/2. The fact is a fixed risk reward ratio is hurting trader's accounts because by setting fixed risk reward ratio you likely ignore the actual market supply and demand level. To turn around try using price action in addition to fixed risk rewards ratio.


Wednesday, April 23, 2014

胡立阳:QE缓退的负面效应 - 3Q 2014

胡立阳:QE缓退的负面效应将在下半年开始显现

==========================================================

Send Friend Requests to https://www.facebook.com/meetup.fx


=========================================================

过去,金融市场 只要一听到QE(量化宽松)可能退场,立即吓得魂飞魄散,但如今QE已正式分批缩减,市场游资反而更加肆无忌惮的炒作,全球有高达20万个亿的资金仍在华尔街的股市、债市中逍遥游,而前阵子已大跌了6成的黄金以及一度走弱的原物料行情也因游资泛滥、大肆炒作而一下子又奔上强势价位。这是怎么一回事?原因就在于美联储采取的是容易令人轻忽的缓退步骤。但难道缓退完全不等于退场吗?缓退就能改变资金已在逐步缩减的事实吗?还有最近金融商品价格竟然表现得如此无畏无惧,这种盛况还能维持多久?
首先,我要说,资金缩减无论采用何种政策都对投资环境不利,负面效应现身只是迟早问题。
过去,我常在演讲会中与大家分享一个我在华尔街所发现的“放掉一缸洗澡水”现象,而藉由这个现象就能理解投资人目前的心态。
快来一起想象一下:当你舒舒服服地泡完澡,起身要放掉一缸洗澡水了,于是你将塞子拔掉,洗澡水开始流失。但你可曾注意,这时的水面只不过稍现涟漪,但事实上,底下已是暗潮汹涌。这个情形是否与当前金融市场的处境极为类似?
由于QE不是一次完全退场,容易造成投资大众的错觉,因此毫无警觉。但以目前缩减的速度推算,2014下半年,应该就会看到洗澡缸中出现的漩涡,到了那个时候,如果毫无防备且已深陷其中的人想要完全脱身可就不太容易了!
或许你会坚持,QE即使全然退场,也不代表即将升息,对吧?但别忘了,只要产生预期心理,就会提前影响股市、房市的价格,尤其是股市,它总是会提前3~6个月反应实际状况!既然如此,就有必要来推算一下出现可怕漩涡的时间表。
根据我最近提出的“QE退场四部曲”的顺序来看,2014年的下半年,预期心理随时会因资金趋紧而开始发酵,美元将会急涨,而对其敏感的黄金、石油等原物料以及部分非美元区货币将再度面临庞大卖压!紧接着,华尔街或是一些一直处在高档的债市、股市将惊慌失措的出现崩跌。最后,由于全球大多数房市早已飙涨过度,价格终于开始松动,但房价真正的大幅滑落,我认为会落在已升息之后的2015年!

Monday, April 14, 2014

Stock and Forex Trading School

So far has many approached me for advise on trading school. I have short listed some here:

==========================================================

Send Friend Requests to https://www.facebook.com/meetup.fx


=========================================================


For General Trading:
Online Traders Club
Technical Analysis Society of Singapore

For Stocks
Daniel Loh - Raffles Business Institute (Stock, index and Options)
Daniel Ang - Singapore Stocks Forum
ChartNexus.com     2-day courses around S$2788 with life long forum,  support, free re-sit, weekly stock review session and six mths free scanner software. (Yearly fee around S$450)

For FX:
FXTrading@SG     $20 per bi-monthly sessoion
Peter Lim Mentorship Program (PLMP)    $300 for one day course
Sonic R - Kyaw Trader
Terraseeds.com


==========================================================

Send Friend Requests to https://www.facebook.com/meetup.fx


=========================================================


Sunday, April 13, 2014

11 Ways the Signal and the Noise Affect Your Investment By Alvin Chow

11 Ways the Signal and the Noise Affect Your Investment
By Alvin Chow

Nate Silver wrote a good book about predictions. I told myself that is an interesting topic since I have seen enough failures trying to predict where the market is going. I want to know what an expert predictor has to say about that. Although he had a chapter dedicated to predictions about the economy and the financial markets, I have included relevant content from the other chapters into this article.


A Beautiful Strategy is Risky

“Hedgehogs are type A personalities who believe in Big Ideas – in governing principles about the world that behave as though they were physical laws and undergird virtually every interaction in society. Think Karl Marx and class struggle, or Sigmund Freud and the unconscious. Or Malcolm Gladwell and the “tipping point”.
Foxes, on the other hand, are scrappy creatures who believe in a plethora of little ideas and in taking a multitude of approaches toward a problem. They tend to be more tolerant of nuance, uncertainty, complexity, and dissenting opinion. If hedgehogs are hunters, always looking out for the big kill, then foxes are gatherers.”
We adore concepts or theories that are neat and simple to understand. They help us understand the world better. However, the world is complex and beautiful theories oversimplify the matter.
Hedgehogs are very good story tellers and we all love to listen to them. Stories are captivating. Complex stories are confusing. We prefer simple theories that can help us organise our thoughts about the world.
Someone must have told a story about the “Golden Cross” and the “Death Cross” in the past and the society sort of accepted it. These are technical analysis jargons. A “Golden Cross” means a 50-day moving average has gone above the slower 200-day moving average in a price chart, and this is a bullish signal. The “Death Cross” is the opposite and it usually signify a crash is imminent. In a short history, we have seen the failure of the “Death Cross” during 2011, which the stock market did not crash after the signal was formed. In fact, the Straits Times Index went higher than the 2011 high.
STI Death Cross
Some would argue not all technical indicators are accurate all the time, and to complete a trading strategy requires money management rules to limit losses when the indicators fail. I agree. But my point is to identify the need to challenge our investment or trading beliefs, and not blindly believing in them. We need to accept we can be wrong all these while and take the courage to change our approach to the market.

Strive to be Less Wrong, to be Right

“[W]e can never achieve perfect objectivity, rationality, or accuracy in our beliefs. Instead, we can strive to be less subjective, less irrational, and less wrong. Making predictions based on our beliefs is the best (and perhaps even the only) way to test ourselves. If objectivity is the concern for a greater truth beyond our personal circumstances, and prediction is the best way to examine how closely aligned our personal perceptions are with that greater truth, the most objective among us are those who make the most accurate predictions.”
To Nate, the best way to be more right is to put your money where your prediction is. We will know how true our beliefs are by the amount of money we have made or lost.

We Need a Longer Period of Backtest

But you could construct a facetious argument for driving yourself home that went like this: out of sample of 20,000 car trips, you’d gotten into just two minor accidents, and gotten to your destination safely the other 19,998 times. Those seem like pretty favourable odds. Why go through the inconvenience of calling a cab in the face of such overwhelming evidence.
The problem, of course, is that of those 20,000 car trips, none occurred when you were anywhere near this drunk. Your sample size for drunk driving is not 20,000 trips but zero, and you have no way to use your past experience to forecast your accident risk. This is an example of an out-of-sample problem.
And the problem of not taking a longer period of historical analysis happened in the rating agencies leading to 2008 financial crisis.
“As easy as it might seem to avoid this sort of problem, the ratings agencies made just this mistake. Moody’s estimated the extent to which mortgage defaults were correlated with one another by building a model from past data – specifically, they looked at American housing data going back to about the 1980s. The problem is that from the 1980s through the mid-2000s, home prices were always steady or increasing in the United States. Under these circumstances, the assumption that one homeowner’s mortgage has little relationship to another’s was probably good enough. But nothing in that past data would have described what happened when home prices began to decline in tandem. The housing collapse was an out-of-sample event, and their models were worthless for evaluating default risk under those conditions.”
STI ETF exist for 12 years and made 8% per year on the average. To Nate Silver, this history is insufficient to determine 8% as the true average, even 120 years is too short in his opinion.
“Take, for instance, the oft-cited statistic that the stock market returns 7 percent annually after dividends and inflation. This is just a historical average. Reliable stock market data only goes back 120 years or so – not all that much data if you really want to know about the long run. Statistical tests suggests that the true long-run return – what we might expect over the next 120 years – could be anywhere from 3 percent to 10 percent instead of 7 percent. The answer to what economists call the “equity premium puzzle” – why stocks have returned so much more money than bonds in a way that is disproportionate to the risks they entail – may simply be that the returned stocks achieved in the twentieth century were anomalous, and the long-run returns is not as high as 7 percent.”
Hence, a proper backtest is more tedious than we desire to conduct it. Taking an easier way out, we often test strategies in the past few years, and it may not be sufficient as market conditions do not stay the same all the time. Volatility spikes once in a while. Market booms and busts happen time to time. We may naively comfort ourselves to assume the strategy works in the future as it had, in the previous few years.

Chaotic Market

“Chaos theory applies to systems in which each of two properties hold:
  1. The systems are dynamic, meaning that the behaviour of the system at one point in time influences its behaviour in the future;
  2. And they are nonlinear, meaning they abide by exponential rather than additive relationships.
If you drop another grain of sand onto the pile (what could be simpler than a grain of sand?), it can actually do one of three things. Depending on the shape and size of the pile, it might stay more or less where it lands, or it might cascade gently down the small hill toward the bottom of the pile. Or it might do something else: if the pile is too steep, it could destabilise the entire system and trigger a sand avalanche. Complex systems seem to have this property, with large periods of apparent stasis marked by sudden and catastrophic failures. These processes may not literally be random, but they are so irreducibly complex (right down to the last grain of sand) that it just won’t be possible to predict them beyond a certain level.”
The Chaos theory applies to the financial market. Booms and busts happen. Price changes are non-linear. There are a million possibilities that may unfold, depending on the interactions among the market participants and the feedback loops they acted upon. Hence, it is a extremely complex matter and we should be wary with the kind of predictions about the economy others try to sell to us.

Correlation not necessarily Equates to Causation

“Likewise, of the millions of statistical indicators in the world, a few will have happened to correlate especially well with stock prices or GDP or the unemployment rate. If not the winner of the Super Bowl, it might be chicken production in Uganda. But the relationship is merely coincidental…
Most of you will have heard the maxim “correlation does not imply causation.” Just because two variables have a statistical relationship with each other does not mean that one is responsible for the other. For instance, ice cream sales and forest fires are correlated because both occur more often in the summer heat. But there is no causation; you don’t light a patch of the Montana brush on fire when you buy a pint of Haagen-Dazs.”
We may have quirky habits. Is there a lucky shirt you would wear whenever you invest? I won’t be surprised if there are such practice somewhere in the world. It may be coincidental that this guy made money from stocks whenever he wore a particular shirt, and it has become a causation factor for him. Is it true or not? It may be an extreme example, but did we mistake correlation for causation?

The Challenge in Predicting where the Economy is Going

“As Hatzius sees it, economic forecasters face three fundamental challenges. First, it is very hard to determine cause and effect from economic statistics alone. Second, the economy is always changing, so explanations of economic behaviour that hold in one business cycle may not apply to future ones. And third, as bad as their forecasts have been, the data that economists have to work with isn’t much good either.
…Most statistical models are built on the notion that there are independent variables and dependent variables, inputs and outputs, and they can be kept pretty much separate from one another. When it comes to the economy, they are all lumped together in one hot mess.
…one difference between weather forecast and economics: “The physics and chemistry of something like a tornado are not all that complicated. That does not mean that tornadoes are easy to predict. But meteorologists have a strong fundamental understanding of what causes tornadoes to form and what causes them to dissipate.
Economics is a much softer science. Although economists have a reasonably sound understanding of the basic systems that govern the economy, the cause and effect are all blurred together, especially during bubbles and panics when the system is flushed with feedback loops contingent on human behaviour.
…If you look at the economy as a series of variables and equations without any underlying structure, you are almost certain to mistake noise for a signal and may delude yourself (and gullible investors) into thinking you are making good forecasts when you are not.
…Who needs theory when you have so much information? But this is categorically the wrong attitude to take toward forecasting, especially in a field like economics where the data is so noisy. Statistical inferences are much stronger when backed up by theory or at least some deeper thinking about their root causes.”
In this  disjunct lifting of quotes from the book, I hope to elicit the points that (1) the economy is more complex than a pure science subject like the weather because the former involves human behaviour, (2) a proper understanding of the economy is required to make a meaningful prediction, but it is lacking at the moment, until perhaps behavioural finance matures. I always do not believe in prediction in where the market is going even though Nate said that bettering predictions is required for society to progress. But right now, I will continue to ignore experts’ or economists’ fortune telling the direction of the markets or the economy.  I am not going to let them affect my investment decisions.


Overconfidence Bias

We are overconfident as humans. We all think we are above average drivers – who is the average then?
“…can be applied to traders on Wall Street, who often think they can beat market benchmarks like the S&P 500 when they usually cannot. More broadly, overconfidence is a huge problem in any field in which prediction is involved.
It probably isn’t mutual funds that are beating Wall Street; they follow too conventional a strategy and sink or swim together. But some hedge funds (not most) very probably beat the market, and some proprietary trading desks at elite firms like Goldman Sachs almost certainly do. There also seems to be rather clear evidence of trading skill among options traders, people who make bets on probabilistic assessments of how much a share price might move. And while most individual, retail-level investors make common mistakes like trading too often and do worse than the market average, a select handful probably do beat the street.”
The danger is that we always look at the select few who beat the market and think we have the chance to do so too. If he can do it, so can I!
“Most poker players are smart enough to know that some players really do make money over the long term – and this is what can get them in trouble.”

Be a Big Fish in a Small Pond

“[W]hen a field is highly competitive, it is only through this painstaking effort around the margin that you can make any money. There is a “water level” established by the competition and your profit will be like the tip of an iceberg: a small sliver of competitive advantage floating just above the surface, but concealing a vast bulwark of effort that went in to support it. Baseball, in the pre-Moneyball era, used to be one of these. Billy Beane got an awful lot of mileage by recognising a few simple things, like the fact that on-base percentage is a better measure of a player’s offensive performance than his batting average. Nowadays pretty much everyone realises that… Poker was also this way in the mid-2000s. The steady influx of new and inexperienced players who thought they had learned how to play the game by watching TV kept the water level low.
If you have strong analytical skills that might be applicable in a number of disciplines, it is very much worth considering the strength of the competition. It is often possible to make a profit by being pretty good at prediction in fields where the competition succumbs to poor incentives, bad habits, or blind adherence to tradition – or because you have better data or technology than they do. It is much harder to be very good in fields where everyone else is getting the basics right – and you may be fooling yourself if you think you have much of an edge.
In general, society does need to make the extra effort at prediction as more of a business proposition, you’re usually better off finding someplace where you can be the big fish in a small pond.”
Is the market you choose to invest or trade a small pond or a big pond with many professionals? Personally I do not like to invest in big caps or stocks that are popular because it is a highly competitive game. Predicting earnings growth is a professional game and I do not think I have much edge in this big pond. I rather invest in undervalued but fundamentally strong small caps. It is a smaller pond with less competition and the low liquidity speaks for that. There aren’t many fund managers, analysts, professional traders in this small pond.

Focus on the Process, and Less on the results

“Play well and win; play well and lose; play badly and lose; play badly and win: every poker player has experienced each of these conditions so many times over that they know there is a difference between process and results.
…The irony is that being less focused on your results, you may achieve better ones.”
Similar to trading and investing where you have a strategy. You should focus on carrying out the strategies and pay less attention to the results. Market is chaotic and you can lose money at times while following the rules of your strategy. You get frustrated and assume your strategy lost the edge and you start to break rules, and yet, it is possible to make money. Jumping in and out of a strategy gives you mixed results and it is better off sticking to the strategy through thick and thin. But the assumption is that the strategy has an edge over the others in the long run.

It pays to be Patient

Speaking about edge, there is one that you can easily exploit, but you may not want to wait. Or would you?
“When the P/E ratio is 10, meaning that stocks are cheap compared with earnings, they have historically produced a real return of about 9 percent per year, meaning that a $10,000 investment would be worth $22,000 ten years later. When the P/E ratio is 25, on the other hand, a $10,000 investment in the stock market has historically been worth just $12,000 ten years later. And when they are very high, above about 30 – as they were in 1929 or 2000 – the expected return has been negative.
However, these pricing patterns would not have been very easy to profit from unless you were very patient. They’ve become meaningful only in the long term, telling you almost nothing about what the market will be worth one month or one year later. Even looking several years in advance, they have only limited predictive power.
…So long as most traders are judged on the basis of short-term performance, bubbles involving large deviations of stock prices from their long-term values are possible – and perhaps even inevitable.
…[O]verconfidence alone was enough to upset an otherwise rational market. Markets with overconfident traders will produce extremely high trading volumes, increased volatility, strange correlations in stock prices from day to day, and below-average returns for active traders – all the things that we observe in the real world.”

We May Be Trading Noise Instead of the Signal

“Some theorists have proposed that we should think of the stock market as constituting two processes into one. There is the signal track, the stock market of the 1950s that we read about in textbooks. This is the market that prevails in the long run, with investors making relatively few trades, and prices well tied down to fundamentals. It helps investors to plan for their retirement and helps companies capitalise themselves.
Then there is the fast track, the noise track, which is full of momentum trading, positive feedbacks, skewed incentives and herding behaviour. Usually it is just a rock-paper-scissors game that does no real good to the broader economy – but also perhaps no real harm. It’s just a bunch of sweaty traders passing money around.
However, these tracks happen to run along the same road, as though some city decided to hold a Formula 1 race but by some bureaucratic oversight forgot to close one lane to commuter traffic. Sometimes, like during the financial crisis, there is a big accident, and regular investors get run over.
…Much technical trading in the stock market probably obeys this sort of cat-and-mouse dynamic, with technical traders simply trying outguess other technical traders. However, the patterns they are trading on can dissipate or even reverse themselves once other investors become aware of them. The result is a lot of money being passed around from trader to trader, but the pile slowly growing smaller as it is eaten away by transaction costs.”
Nate Silver seems to be inclined to fundamental analysis, or value investing, as he called it the Signal. He is opposed to trading, which he described it as making buy and sell decisions based on noises.

Conclusion

Some of these points have made me challenged my assumptions and I felt uncomfortable at times. But we need to be truthful to ourselves and review what we are doing. We become more right when we are less wrong. Nate Silver did a good job with this book – challenging the way we conduct ourselves in the real world.

========================== 14Apr14 ========================================


Set Up for Stock Market Crash - 17May14, 14Apr14


========================== 17May14 =========================
Setup for Market Crash

MIAMI (MarketWatch) — This is how bear markets begin.
Two months ago, I pointed out that the U.S. stock market had topped out and was going through a churning process.
Since that observation, the Dow Jones Industrial Average DJIA +0.27%   has risen a bit higher but the Nasdaq COMP +0.52%  and Russell 2000 RUT +0.63%  indexes have dropped below their 50-day and 100-day moving averages. It’s only a matter of time before the Dow follows.

Bond yields may signal a warning

Yields on 30-year Treasury bonds have fallen this year, which could be a signal that economic growth will not heat up anytime soon.
Bear markets start with a whimper or a bang. When it starts with a bang, the first clue will be a major break in the market that no one can correctly explain. That will eventually be followed by a correction (or crash), and everyone will know that something bad has happened. The indexes will fall by double digits, investors will panic, and stocks get slaughtered.

Investors will be told to stay calm and not sell — but they will when the financial pain gets too great. They are also told that the market always comes back (although not all stocks will). Anxiety turns to fear as the market plunges. After a correction or crash, investors look for scapegoats while commentators ask, “Who could have known?” (Hint: Those willing to act on the clues and indicators were out of the market well before the most damage was done.)
But when a bear market starts with a whimper, it confuses nearly everyone. A meandering, volatile market is frustrating. At first, bulls are hopeful that the market will keep going up, but eventually, the market tops out and retreats.
I call this “death by a thousand pullbacks.” Instead of new highs, the market will make a series of short-lived but painful pullbacks. At first, the buy-on-the-dip investors will enter the market with new orders. As the bear market continues, the buy-on-the-dip strategy will stop working (along with most other long strategies).
Typically, a market making new highs is a healthy sign. In a looming bear market, new highs on lower volume is a red flag. That’s happening now. Also, leading technology stocks have gotten smashed, replaced by new leaders. After these new leaders fail there will be nowhere to hide.

Confusion and illusion

You may have noticed that some financial analysts on television seem confused. One week they make a bearish prediction, then reverse course. This is typical as the market transitions to a bear market.
Many commentators are confused because what has worked in the past stops working. Also, the behavior of other assets such as bonds and commodities don’t make sense. That’s a clue the market is entering a danger zone. Another red flag: Investors are buying stocks on margin at levels higher than in the previous peak years of 2008 and 2000. Whenever margin reaches excessive levels, bad things happen to the stock market.
Short-term, the market could churn higher. As prices rise, a lot of people will be fooled, especially if the Dow continues to make all-time highs. Many investors will not sell because they think they can either get out in time, or buy and hold through the next pullback or correction. The most aggressive investors will buy on the dip because stocks “are so cheap.” I’ve heard some financial commentators recommend that retail investors avoid a bear market by being “better stock pickers.” Ridiculous.
Here’s some advice: Rather than trying to be a stock-picking genius, before a bear market shreds your portfolio, think about getting out of the market even if you’re early. I’d rather give up 5% potential upside than risk 20% downside (or more).
Right now, the strongest case for the bulls is the Fed. And yet, in the history of the stock market, no institution has been able to prevent a bear market. You can’t fool Mother Market.

Waiting for the pivot point

Eventually there will be a pivot (or inflection) point, and the market will snap. No one knows what the catalyst will be. It could be an economic event, a geopolitical crisis, or a spike in interest rates.
When the market snaps, nearly everyone but the biggest believers will realize the market is in trouble. By that time, there will be a mad rush for the exits as everyone attempts to sell at once.
No matter how many times you tell investors to be wary of a dangerous market, most don’t listen. Based on the clues, indicators, and personal observations, crunch time is getting closer. No one knows when, but I am certain: a bear market is inevitable — sooner rather than later. This is not doom and gloom. It is market reality.
Michael Sincere (www.michaelsincere.com) is the author of “Understanding Options,” “Understanding Stocks,” and “Predict the Next Bull or Bear Market and Win.” 

================================= 14Apr14 ========================


http://solarcycles.net/2014/04/13/set-up-for-a-stock-market-crash/

Set Up For A Stock Market Crash
Last week I posted 30 bearish indicators here. Since then equities have begun to sell off and change trend after historic and solar-maximum inspired levitation. There is a long way to go to mean-revert, wash-out or fulfil these indicators, but that can be achieved in a shorter timescale with the help of HFT by way of a crash or waterfall declines.
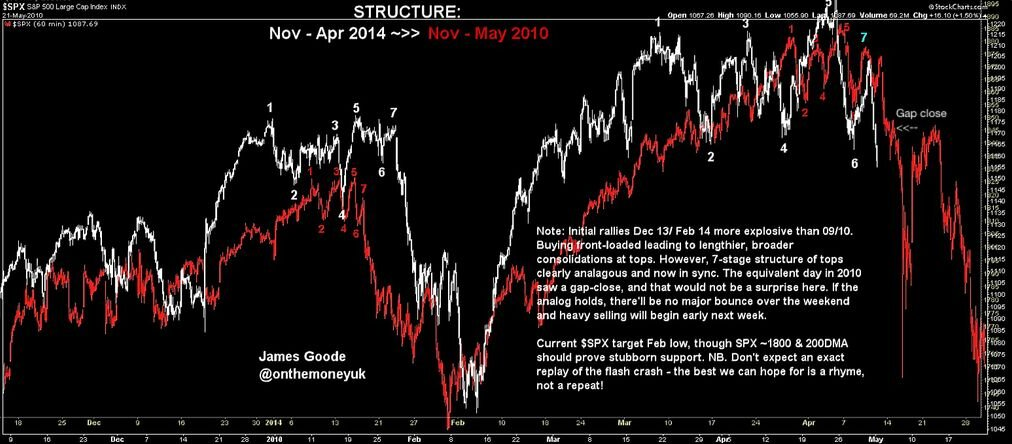
Within that list of indicators we see identification similar to the backdrop to the May 2010 flash crash, and I posted about that here.
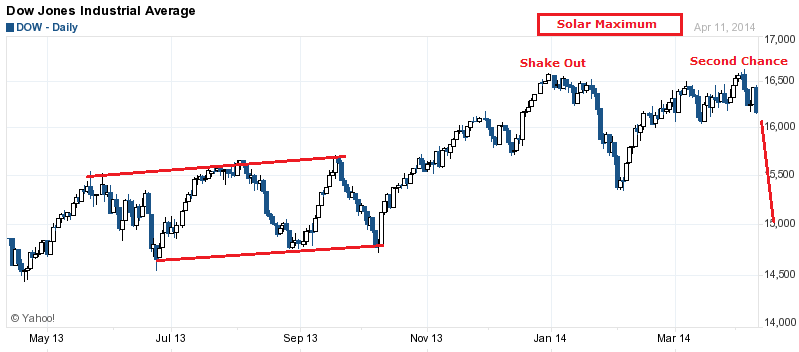
We see a similar price pattern into the flash crash repeated here too:
13ap1
Source: James Goode
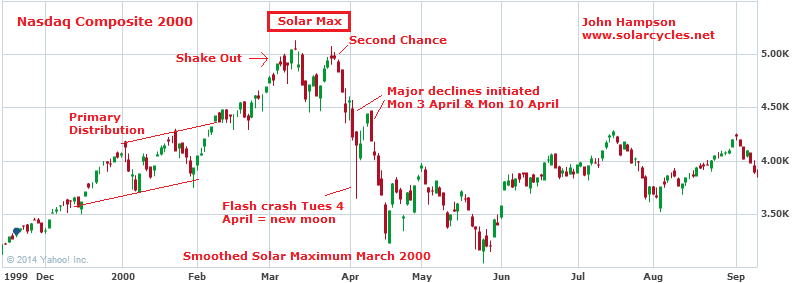
We also see identification similar to the Nasdaq peak in 2000, before a flash crash and waterfall declines:
13ap2
13ap1
And the same applies to the Nikkei 1989 and solar maximum.
Additionally, recall that major declines in history have often initiated following a weekend, where equities sold off into the Friday close, and market participants have time to stew Saturday and Sunday. Stocks sold off into the close on Friday, in a fairly decisive Thu-Fri trend change.
Recall that the biggest decline days in history have typically occurred close to new moons and full moons. This coming Tuesday is a full moon.
Recall that geomagnetism is bearish for the stock market. We have been experiencing geomagnetic disturbance both Saturday and Sunday this weekend.
Recall that periods of heavy falls in the stock market have typically occurred in the inverted geomagnetic seasonal lows of March/April and October. This is April.
In short, the set-up is here for a crash or waterfall declines, and the greatest potential lies in Mon April 14 – Tues April 15 (tomorrow and Tuesday) for a major historic down day. I balance that with certain short term indicators suggestive of bounce potential, and were that to occur we might look to around the new moon of April 28th for fulfillment. But the crash set up is there for tomorrow, so let’s see.


Tuesday, April 8, 2014

How to trade FOMC?

The Federal Open Market Committee (FOMC) interest rate decision is one of the most influential indicators for the US dollar and you can be sure after the news is released there is going to be volatility in the markets and volatility is what traders thrive on.

Many 'traders' say never to trade the news and especially the FOMC. Although the FOMC interest decision is a news event and can fall under the category of through fundamental analysis I am a technician and I believe that charts always price everything in. However I guarantee the market does not know what exactly the Feds comments and decision will be, therefore it is not priced in yet and this will cause the markets to react when they do find out. This is confirmed by the change in price after the decision and the continuation in the days following.

The most common pattern to trade the Fed is the whip-saw. But do not be fearful of it, embrace it. Here is how it happens, first there is a large spike one direction (traders come in and follow that direction)followed by a large spike in the opposite direction (those same traders now sell their first position at a loss and reverse their position - this is when I take a position in the direction of the original move)followed by an extended move back in the direction of the original spike (all the emotional trades are left sick to their stomachs) and I am left holding a very nice position setting myself up to capture a larger than average market move.

If this pattern does not play out exactly as outlined I stand on the sidelines and do not trade at all. Because the markets are moving fast in the period following the FOMC interest rate decision I am watching a very short time frame, mainly the one and five minute charts.