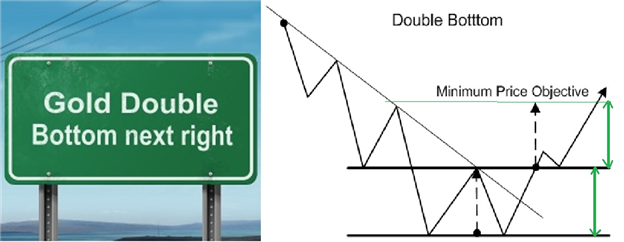
- The Forex Double Bottom pattern is a bullish reversal pattern consisting a second test of a previous low followed by a rebound higher.
- Forex traders can determine a profit objective by measuring the distance from the bottom of the pattern to the middle peak
- The Daily time frame gold chart clearly illustrates the Double Bottom chart pattern
The Forex double bottom pattern is widely popular among traders because it is easy to recognize, provides clear locations to place stops, and forecasts clear profit targets. Typically, the double bottom will take a familiar letter “W” pattern. This pattern is common on time frames as large as yearly and monthly charts and on smaller time frames like hourly, 5-minute, and even tick charts. We are going to discuss the method for trading this pattern and then look at a real-time example unfolding in gold.
Double bottom price patterns are usually found at the end of downtrends. The previous downtrend consisting of lower swing highs and lower swing lows begins to accelerate as sellers take full control. Next, price makes an extreme low as more and more sellers pile into the trade, however the extreme move is met with a combination of bargain hunters and sellers taking profits. The following rally creates the peak of the ‘W’ pattern that makes up the double bottom. The rally to the peak is what sellers, who missed the initial decline, were waiting for.
With price trading against the downtrend line, sellers come in and push prices lower one last time hoping for another long run down that mirrors the previous drop. However, when price fails to make a new low and stalls, sellers begin to abandon the trade and close out their positions. This time, buyers are more confident and are emboldened to buy the bounce because sellers were unable to make a lower low.
While traditionally, traders usually wait to get long with a close above the double bottom peak, more aggressive traders will buy the close above the broken downtrend line with a stop placed below the last swing low. A first limit would then be set at the peak high of the double bottom with a second target set at two times the height of the pattern. This reduces the amount of risk taken when trading this pattern as the stop will be at a smaller distance from the trend line break than from the top of the pattern breakout.
Learn Forex: Gold Double Bottom
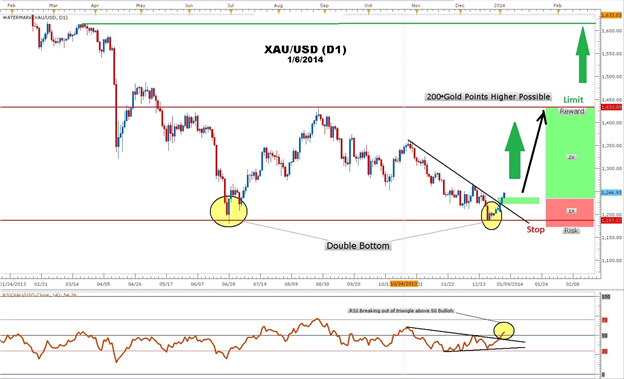
(Created with Market Scope 2.0)
The Trade Setup
After falling nearly $300/oz. on 6/28, Gold (XAUUSD) has just completed a retest of 6-month lows in the 1188 area on 12/20. On the chart above, you can clearly see the double pattern unfolding. Gold’s slow and steady rebound has led to three days above the previous downtrend line. RSI is a technical indicator that traders use to determine momentum.
RSI generates a buy signal when it moves below 30 and rise to above 30. RSI also generates a buy signal when it moves above 50. RSI stands at 54 which is bullish for gold. Measuring the height of the pattern we get about 245 gold pips. Adding this to the top of the pattern and we get a profit target just above $1600/oz. Remember to place no more than 2% of your account at risk on any one trade as pattern failure and whipsaws are possible that could trigger stops. The double bottom pattern can be a ‘golden’ ticket for traders because its ease of use.
--- Written by Gregory McLeod, Trading Instructor
No comments:
Post a Comment