Depending on the distance from the previous high or low point within a range, the change in price can be predicted with almost 60-70% accuracy. Please note that this was the estimate given by website harmonic-trader.com. These percentages can be greatly exaggerated and are subject to a variety of factors including risk and money management.
Fibonacci
The important questions that need to be asked when analyzing the viability of harmonics is how they are calculated and why are they assigned a high probability label. One of the key components of harmonic trading is Fibonacci.
“The Fibonacci sequence of numbers is as follows: 0, 1, 1, 2, 3, 5, 8, 13, 21, 34, 55, 89, 144, etc. Each term in this sequence is simply the sum of the two preceding terms and sequence continues infinitely.” (Investopedia,2013)
The traditional mathematical formula has been adapted to trading to identify levels of support and resistance within a given range. Harmonics use the sequence to calculate whether there is potential for reversal in the price.
Different Types of Patterns
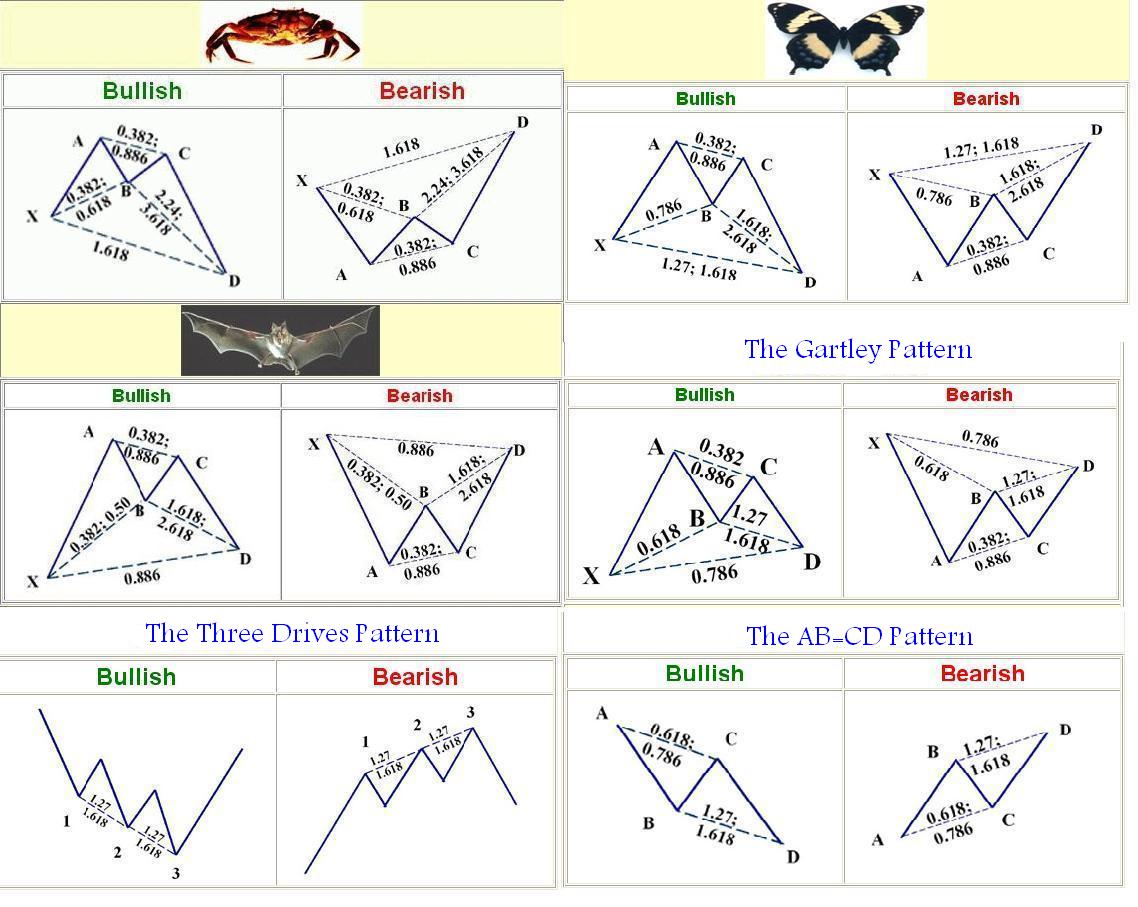
Harmonic trading patterns are mathematically based and have different probabilities of success
Source: http://fib618.wordpress.com/fx-strategy/harmonic-patterns/
- AB=CD
- Bat
- Butterfly
- Crab
- Gartley
- Shark
- 50
- Three Drives
Each of the above patterns will be analyzed in detail in follow up posts.
Advantages
- High Probability
With a high success rate, Harmonic trading is increasingly becoming popular with retail traders. As it utilities mathematics and geometry to determine entry and exit points, there is little room for error. It is important however to choose the right pattern and not overtrade. Although there are a number of different setups, the high probability patterns include the Gartley, Crab, Shark and AB=CD.
- Trend Reversal Forecasting
Another key advantage of Harmonic trading is its trend reversal forecasting capability. In essence, a trader can see whether or not a price movement is at its beginning or end. Once again it is dependent on the choice of harmonic pattern. Traditionally hedge funds that trade on exhaustion (overbought or oversold) situations will use harmonics as one of their many tools to identify reversals.
Disadvantages
- Complex
Setting up a chart to identify harmonic patterns can be quite complex. As they are based on mathematical and geometrical calculations, a normal trader would not be able to identify a pattern without using an indicator or overlay chart.
- High Risk
Harmonic Trading can involve significant risk if not managed effectively. As the patterns attempt to identify reversals in a trend, they can sometimes be too early or incorrect. This can lead to the trader betting against the market and momentum. It is always important to impose strict risk and money management rules.
- Curve Fitting Results – Back test
Hindsight can be a beautiful thing in most cases, however when it relates to harmonics it is not. Curve fitting can occur when back testing harmonic patterns. This is due to the fact that a trade setup may have existed at the time, however the trigger will not show in the back test, as the trend has continued and broken down.
To reduce such risk, it is important to stress test using out of sample data. This can be done by choosing random and specific data ranges, and testing the performance for that period. If the success rate or figures are completely different, then it is curve fitted.
Charting
Following on from our previous comment pertaining to high risk and complex, charting harmonic patterns can be challenging for most traders. It is almost impossible to identify trade setups without using a predefined layover chart or indicator. Remember, timing and execution efficiency are key in harmonic trading, hence the requirement for a mechanised system.
For a harmonic indicator and expert advisor, please contact one step removed.
Risk Management
A common risk management technique to adopt when trading harmonics is the 1 to 2 risk reward. The reason for this choice is the level of risk. Harmonics can be great at picking reversals in price, however when they breakdown, they can be very ugly indeed, and can cause significant losses. Once again an automated system that sets specific stop loss and take profit levels would reduce this risk
Quantum Binary Signals
ReplyDeleteProfessional trading signals delivered to your cell phone daily.
Follow our trades NOW & profit up to 270% per day.
Can hardly wait for another blog by this essayist.
ReplyDelete먹튀검증